
From RCT data to survey instruments: how to find what you need on the J-PAL Dataverse

Data publication is a key tool in advancing open and transparent research practices that can enhance the ability of economics researchers to replicate and learn from data, with downstream effects on future research. Importantly, publication opens the data for use by the broader research community, including students who can learn from it, policy partners who supported the study, and the communities from which it was collected.
In recognition of the need for more open and transparent data sharing, we established the J-PAL dataverse in 2008 and published its first dataset. We also created incentives for data publication, including requiring publication for J-PAL-funded studies, establishing best practices for data cleaning and publication, and helping affiliates document, clean, and publish individual data sets.
Since 2008, over 400 datasets from randomized evaluations led by J-PAL affiliated researchers have been published, with 130 of them on our own dataverse. We started tracking this more robustly in June 2018 to get a better understanding of whether and how this data is being used. Since 2018, the datasets on the J-PAL Dataverse have been downloaded over 10,000 times by users at varying stages in their research careers and for purposes ranging from classroom exercises to original research and replication.
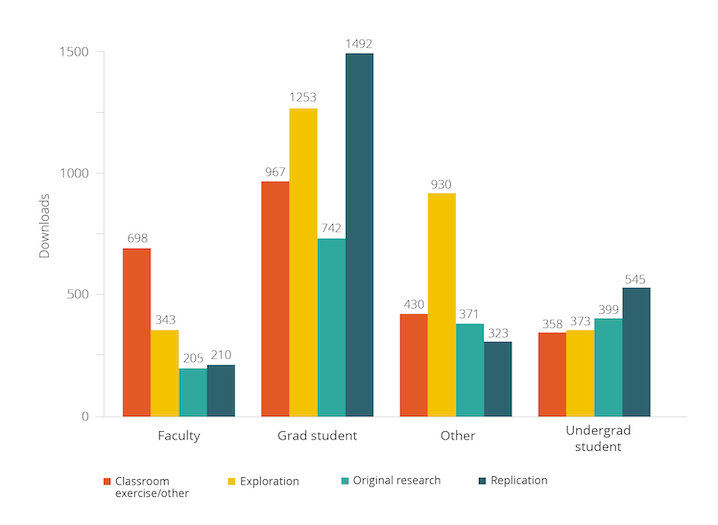
This post is the first in a two-part series to highlight both why and how to use the J-PAL Dataverse. The goal of this first post is to provide a user-friendly guide to access our data, and a starter menu of use cases of data from randomized control trials (RCTs) for students, researchers, teachers, and other data users. It also builds on a previous blog aimed at motivating researchers to publish data from their projects.
Getting started with the J-PAL Dataverse: What’s in a dataset?
The J-PAL Dataverse is housed within the Harvard University Dataverse, an open source repository available to all researchers and research organizations. Our Dataverse is part of the Datahub for Field Experiments in Economics and Public Policy, which brings together datasets from projects funded or implemented by J-PAL and our sister organization Innovation Poverty Action (IPA), as well as metadata from the American Economic Association RCT Registry.
The typical entry in the J-PAL Dataverse is a replication package that contains the data and code used to replicate an associated academic paper describing the results of an RCT. The package will also often contain a description of the available materials and the project from which they came, a codebook providing variable-level metadata, and any survey instruments used to collect the data.
Step 1: Searching datasets
Within the J-PAL Dataverse, there are three main ways to find datasets of interest: 1) simple searching by keyword, 2) filtering on metadata, and 3) advanced searching by keyword and one or more metadata fields. We’ll take you through each one in turn.
1. Locating datasets using a keyword search
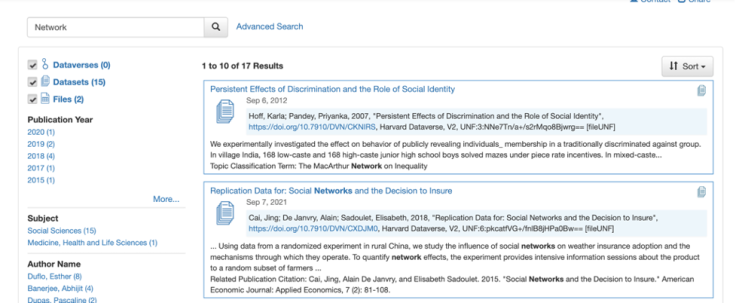
The first and easiest way to get quick subsets of the datasets published on the dataverse is to perform a simple keyword search. For example, say you are broadly interested in finding data from any RCT that involves analyzing networks in order to look at the general structure of the data. You can start by simply searching for “network” in the search bar in the upper left corner of your screen. Even this simple subsetting pares the datasets down to just 17 results. While not all of the results may actually contain network data, it will now be much easier to find a dataset that does (in this case, the second option in the figure below).
2. Filtering on metadata to narrow the search
Another way to search data is through the selection of filters on the side pane of the J-PAL Dataverse landing page. When we publish datasets on the dataverse, we also publish the respective metadata that describes its properties (for instance, what topics the dataset covers, how it was collected, what geographic areas it includes, the unit of analysis etc.).
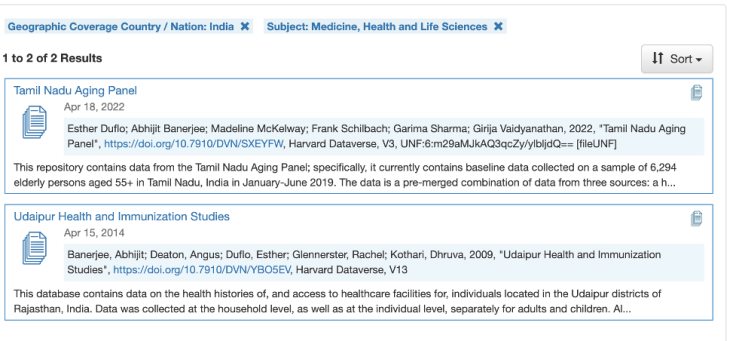
The content of these fields appear in the left-hand side of the screen under the respective bolded heading. You can also sequentially filter on multiple fields by choosing your first filter and then choosing another once the page has reloaded with your subset of datasets. The screenshot below shows an example filter of all datasets whose geographic coverage is “India,” and who have a subject tag of “Medicine, Health and Life Sciences.”
3. Combining searching and filtering for precise results
The advanced search allows you to specify over which level of materials (e.g., packages versus individual datasets/files) and metadata fields you would like to restrict your search. With this option it is also possible to conduct two or more queries at once, which can be particularly helpful when you are interested in looking for specific files within datasets.
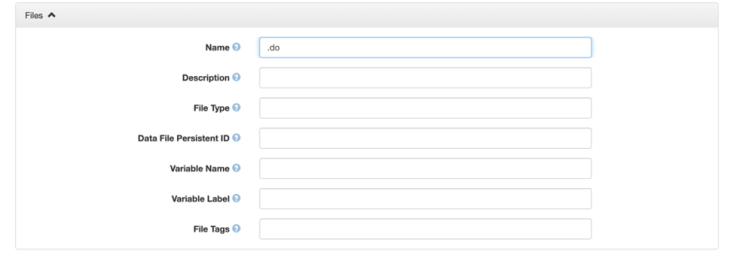
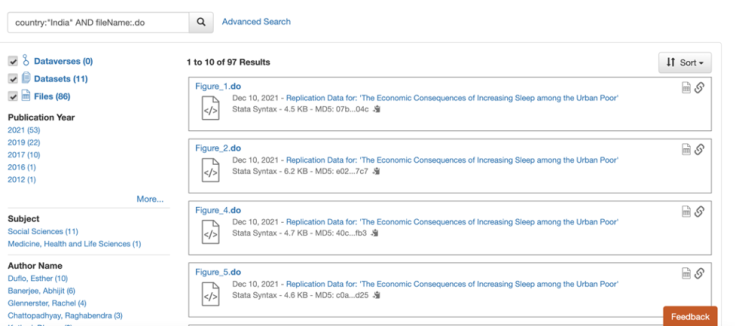
For example, the screenshots below show the search you would conduct to find all Stata do-files from projects that were conducted in India and its results.
To make your advanced searches more effective, it is helpful to recognize the difference between dataset- and file-level metadata, and to decide what you need from both. Dataset-level metadata is used to describe the project and data collection as a whole (for instance, topic, geographic coverage, unit of analysis, kinds of data, and modes of data collection etc.). File-level metadata, on the other hand, allows you to filter within the datasets that meet your project-level criteria, including by file type (like “R” and “Stata”) or by file tag (like “documentation”). For instance, selecting “India” in the “Geographic Coverage” field would be a dataset-level filter to get just the projects that were conducted in India; narrowing the search further by searching for “.do” in the “File Name” field would subset to all do-files within those projects.

Step 2: Accessing the relevant data and files
You have identified the datasets and other files you want to download. Now, how do you access them?
If you would like to download the entire dataset, you can use the “Access dataset” button to download all files in either their original or archival format. The archival format for datasets in dataverse is .tab (tab-separated values, similar to .csv) and it provides the data in a format that won’t degrade over time. The original format will be the same format as uploaded by the research team (e.g., .dta, .csv, etc.).
On the other hand, if you are only interested in a subset of files from the package, you can use the check-boxes to the left of the file names to select which ones you would like to download. In cases where you are only interested in a few files and the datafiles are large, this can save time and computer memory.
Step 3: Exploring additional dataverse uses: Replication, survey instruments, and more
The J-PAL dataverse is not simply a data warehouse. The majority of the datasets within the dataverse are replication packages, meaning that in addition to the data they contain the code and documentation necessary to reproduce the analysis in the paper associated with the dataset.
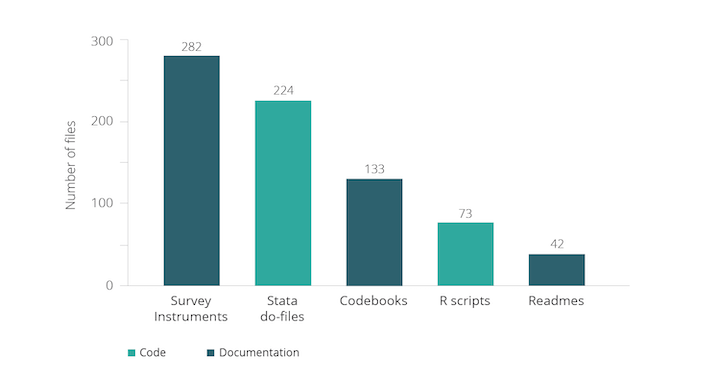
Moreover, we strongly recommend the research teams that publish on the dataverse include the survey instruments used in data collection. The graph below gives rough counts of the number of other types of files typically found in the J-PAL dataverse (note that it is likely an undercount because of different naming conventions and many datasets that are zipped within the dataverse). These materials are complementary to the data and in some cases may even be more useful than the data itself. We present two potential cases at different stages of the research process below.
Designing survey instruments and measurement
Survey design and measurement are two of the most challenging and important aspects of impact evaluations. Many considerations factor into deciding what will be measured in a research project, and how best to measure it. There are many existing resources that can help understand these aspects of research design conceptually, including those listed in our Repository of measurement and survey design resources. The resources posted on the dataverse can be especially useful for seeing how those concepts have been implemented in previous research.
Consider a case in which you are designing a survey for an experiment that is attempting to determine the impacts of a child health intervention. You have already looked through the health section of our repository or another resource to determine your list of outcome indicators and approaches to measuring them. However, you would like examples to help better phrase and format your questions.
You can find such examples in the dataverse by running an advanced search on the description field of the dataset (for “child health”) and the tag field for files (for “surveys”). This will show survey files associated with data uploads from evaluations of child health policies; specifically, this search pulls up survey instruments from a variety of child health and education projects.
Reusing dataverse analysis code
Let's say you have data from an evaluation of the child health project and would like to analyze it—for a research paper, for a course, etc. You are interested in the effect of the intervention on a number of outcomes, such as height, weight, and height-for-age z-score, and would like to create an index to avoid testing multiple hypotheses for many related outcomes. The resources and sample code from J-PAL's data analysis guide were a helpful start, but you want to see how other researchers have created outcome indices.
In this case, a simple search of “index” on the J-PAL dataverse comes up with a number of code files and datasets that contain “index” in either their title or in a variable label. From here you can download the appropriate analysis scripts and see the exact logic behind different indices.
What if you have a preference for R or Stata? The search results can be restricted to just scripts in those languages using the “File Type” field in the advanced search, which recognizes both “R” and “Stata” as file types.
What’s next?
This post has described the J-PAL dataverse typical dataset, and provided initial guidance on best practices for finding and downloading not only data, but also code, survey instruments, and other useful components of replication packages. However, this is only a brief look at a powerful resource, and the best way to get comfortable with it is to try it out on your own!
The second iteration of this two-part series will help you brainstorm possible uses of datasets published on the J-PAL dataverse. It will guide researchers, students, teachers, and policymakers through potential use cases, tailored to their experience and needs. Stay tuned!

