From RCT data to survey instruments: how to find what you need on the J-PAL Dataverse
Data publication is a key tool in advancing open and transparent research practices that can enhance the ability of economics researchers to replicate and learn from data, with downstream effects on future research. Importantly, publication opens the data for use by the broader research community, including students who can learn from it, policy partners who supported the study, and the communities from which it was collected.
In recognition of the need for more open and transparent data sharing, we established the J-PAL dataverse in 2008 and published its first dataset. We also created incentives for data publication, including requiring publication for J-PAL-funded studies, establishing best practices for data cleaning and publication, and helping affiliates document, clean, and publish individual data sets.
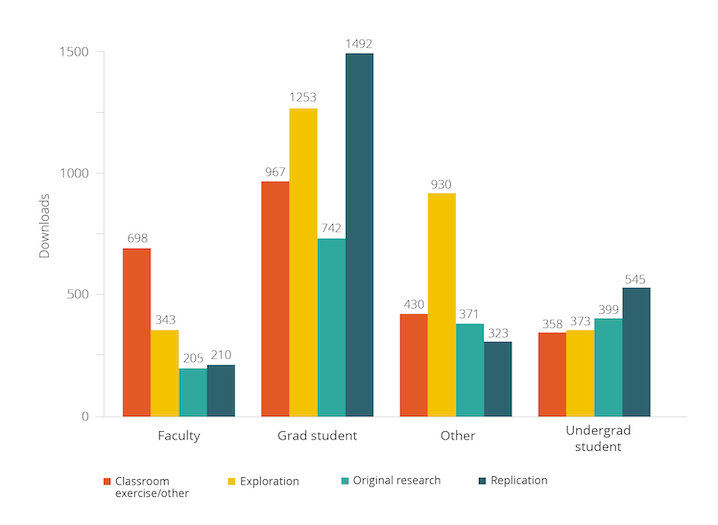
Since 2008, over 400 datasets from randomized evaluations led by J-PAL affiliated researchers have been published, with 130 of them on our own dataverse. We started tracking this more robustly in June 2018 to get a better understanding of whether and how this data is being used. Since 2018, the datasets on the J-PAL Dataverse have been downloaded over 10,000 times by users at varying stages in their research careers and for purposes ranging from classroom exercises to original research and replication.
This post is the first in a two-part series to highlight both why and how to use the J-PAL Dataverse. The goal of this first post is to provide a user-friendly guide to access our data, and a starter menu of use cases of data from randomized control trials (RCTs) for students, researchers, teachers, and other data users. It also builds on a previous blog aimed at motivating researchers to publish data from their projects.
Getting started with the J-PAL Dataverse: What’s in a dataset?
The J-PAL Dataverse is housed within the Harvard University Dataverse, an open source repository available to all researchers and research organizations. Our Dataverse is part of the Datahub for Field Experiments in Economics and Public Policy, which brings together datasets from projects funded or implemented by J-PAL and our sister organization Innovation Poverty Action (IPA), as well as metadata from the American Economic Association RCT Registry.
The typical entry in the J-PAL Dataverse is a replication package that contains the data and code used to replicate an associated academic paper describing the results of an RCT. The package will also often contain a description of the available materials and the project from which they came, a codebook providing variable-level metadata, and any survey instruments used to collect the data.
Step 1: Searching datasets
Within the J-PAL Dataverse, there are three main ways to find datasets of interest: 1) simple searching by keyword, 2) filtering on metadata, and 3) advanced searching by keyword and one or more metadata fields. We’ll take you through each one in turn.
1. Locating datasets using a keyword search
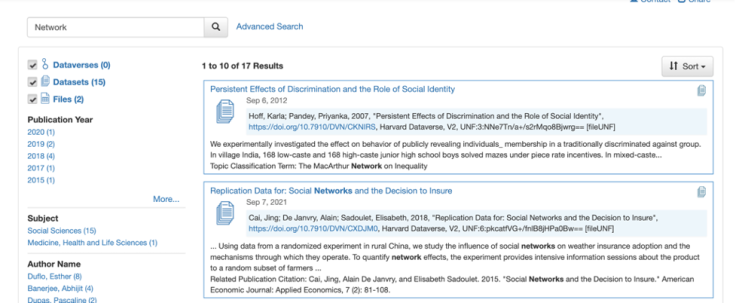
The first and easiest way to get quick subsets of the datasets published on the dataverse is to perform a simple keyword search. For example, say you are broadly interested in finding data from any RCT that involves analyzing networks in order to look at the general structure of the data. You can start by simply searching for “network” in the search bar in the upper left corner of your screen. Even this simple subsetting pares the datasets down to just 17 results. While not all of the results may actually contain network data, it will now be much easier to find a dataset that does (in this case, the second option in the figure below).
2. Filtering on metadata to narrow the search
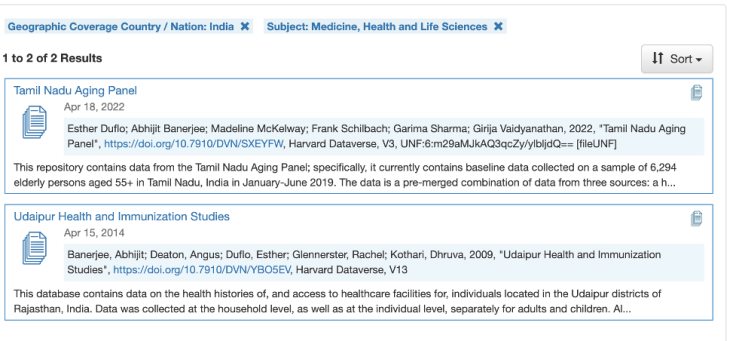
Another way to search data is through the selection of filters on the side pane of the J-PAL Dataverse landing page. When we publish datasets on the dataverse, we also publish the respective metadata that describes its properties (for instance, what topics the dataset covers, how it was collected, what geographic areas it includes, the unit of analysis etc.).
The content of these fields appear in the left-hand side of the screen under the respective bolded heading. You can also sequentially filter on multiple fields by choosing your first filter and then choosing another once the page has reloaded with your subset of datasets. The screenshot below shows an example filter of all datasets whose geographic coverage is “India,” and who have a subject tag of “Medicine, Health and Life Sciences.”
3. Combining searching and filtering for precise results
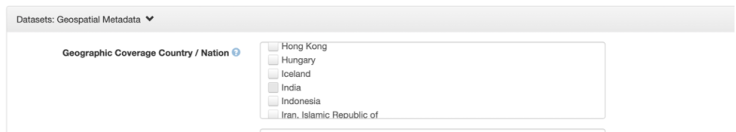
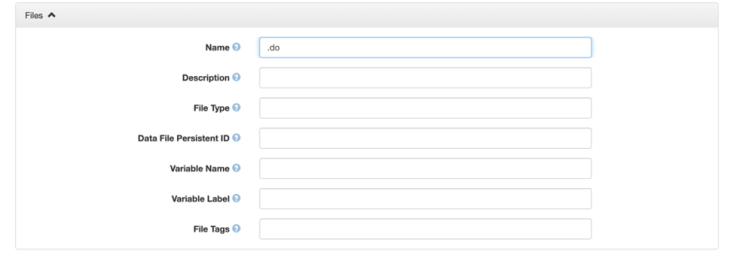
The advanced search allows you to specify over which level of materials (e.g., packages versus individual datasets/files) and metadata fields you would like to restrict your search. With this option it is also possible to conduct two or more queries at once, which can be particularly helpful when you are interested in looking for specific files within datasets.
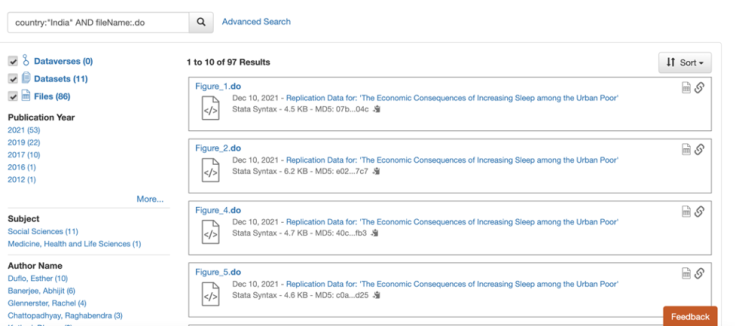
For example, the screenshots below show the search you would conduct to find all Stata do-files from projects that were conducted in India and its results.
To make your advanced searches more effective, it is helpful to recognize the difference between dataset- and file-level metadata, and to decide what you need from both. Dataset-level metadata is used to describe the project and data collection as a whole (for instance, topic, geographic coverage, unit of analysis, kinds of data, and modes of data collection etc.). File-level metadata, on the other hand, allows you to filter within the datasets that meet your project-level criteria, including by file type (like “R” and “Stata”) or by file tag (like “documentation”). For instance, selecting “India” in the “Geographic Coverage” field would be a dataset-level filter to get just the projects that were conducted in India; narrowing the search further by searching for “.do” in the “File Name” field would subset to all do-files within those projects.
Step 2: Accessing the relevant data and files
You have identified the datasets and other files you want to download. Now, how do you access them?
If you would like to download the entire dataset, you can use the “Access dataset” button to download all files in either their original or archival format. The archival format for datasets in dataverse is .tab (tab-separated values, similar to .csv) and it provides the data in a format that won’t degrade over time. The original format will be the same format as uploaded by the research team (e.g., .dta, .csv, etc.).
On the other hand, if you are only interested in a subset of files from the package, you can use the check-boxes to the left of the file names to select which ones you would like to download. In cases where you are only interested in a few files and the datafiles are large, this can save time and computer memory.
Step 3: Exploring additional dataverse uses: Replication, survey instruments, and more
The J-PAL dataverse is not simply a data warehouse. The majority of the datasets within the dataverse are replication packages, meaning that in addition to the data they contain the code and documentation necessary to reproduce the analysis in the paper associated with the dataset.
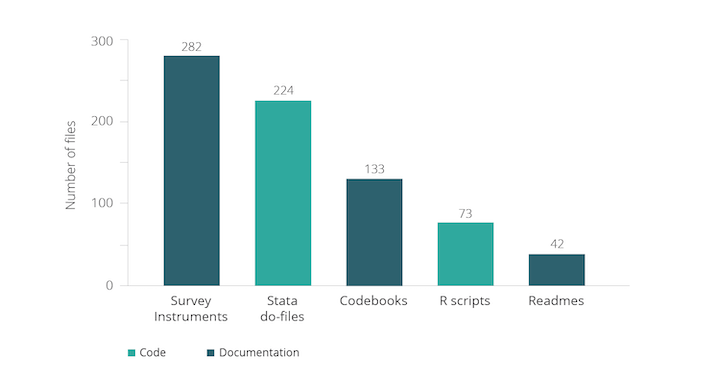
Moreover, we strongly recommend the research teams that publish on the dataverse include the survey instruments used in data collection. The graph below gives rough counts of the number of other types of files typically found in the J-PAL dataverse (note that it is likely an undercount because of different naming conventions and many datasets that are zipped within the dataverse). These materials are complementary to the data and in some cases may even be more useful than the data itself. We present two potential cases at different stages of the research process below.
Designing survey instruments and measurement
Survey design and measurement are two of the most challenging and important aspects of impact evaluations. Many considerations factor into deciding what will be measured in a research project, and how best to measure it. There are many existing resources that can help understand these aspects of research design conceptually, including those listed in our Repository of measurement and survey design resources. The resources posted on the dataverse can be especially useful for seeing how those concepts have been implemented in previous research.
Consider a case in which you are designing a survey for an experiment that is attempting to determine the impacts of a child health intervention. You have already looked through the health section of our repository or another resource to determine your list of outcome indicators and approaches to measuring them. However, you would like examples to help better phrase and format your questions.
You can find such examples in the dataverse by running an advanced search on the description field of the dataset (for “child health”) and the tag field for files (for “surveys”). This will show survey files associated with data uploads from evaluations of child health policies; specifically, this search pulls up survey instruments from a variety of child health and education projects.
Reusing dataverse analysis code
Let's say you have data from an evaluation of the child health project and would like to analyze it—for a research paper, for a course, etc. You are interested in the effect of the intervention on a number of outcomes, such as height, weight, and height-for-age z-score, and would like to create an index to avoid testing multiple hypotheses for many related outcomes. The resources and sample code from J-PAL's data analysis guide were a helpful start, but you want to see how other researchers have created outcome indices.
In this case, a simple search of “index” on the J-PAL dataverse comes up with a number of code files and datasets that contain “index” in either their title or in a variable label. From here you can download the appropriate analysis scripts and see the exact logic behind different indices.
What if you have a preference for R or Stata? The search results can be restricted to just scripts in those languages using the “File Type” field in the advanced search, which recognizes both “R” and “Stata” as file types.
What’s next?
This post has described the J-PAL dataverse typical dataset, and provided initial guidance on best practices for finding and downloading not only data, but also code, survey instruments, and other useful components of replication packages. However, this is only a brief look at a powerful resource, and the best way to get comfortable with it is to try it out on your own!
The second iteration of this two-part series will help you brainstorm possible uses of datasets published on the J-PAL dataverse. It will guide researchers, students, teachers, and policymakers through potential use cases, tailored to their experience and needs. Stay tuned!
Empirical work in the social sciences often uses primary data collected by researchers, or other data that is not yet publicly available. Researchers spend lots of time and money to collect these data; yet after the publication of the paper, the data frequently sits in their files, rarely revisited and slowly buried, unless it is published and shared.
There has been a growing research transparency movement within the social sciences to encourage broader data publication. In this blog post we share some background on this movement and recent statistics, key factors for researchers to consider before publishing data, and tools and resources to support data publication efforts.
The research transparency movement
The notion of “open data”--the concept that data collected by researchers should be shared publicly without costs incurred by secondhand users--has been promoted by a handful of social science institutions, including the Inter-university Consortium for Political and Social Research (ICPSR), the Open Science Framework (OSF), and the Harvard Dataverse, hosted by the Institute for Quantitative Social Sciences (IQSS).
Other interesting projects (like Code Ocean and Two Ravens) have been developed to facilitate replication, data exploration, and analysis of published data. These open data initiatives aim to reduce the costs incurred by researchers in sharing their data.
Many social science journals have supported open data by putting data publication policies in place. Economics and political science journals are most likely to require authors to submit both code and data (Table 1). (Submitted code often takes the form of either the final code file that runs analyses on cleaned data, or a set of multiple files which include the final analysis code as well as code that cleaned the raw data and produced final estimation data.)
Back in May 2016, J-PAL affiliate Paul Gertler, with Sebastian Galiani and Mauricio Romero, authored a paper that looked at articles published in the previous three issues of nine leading economics journals to determine how many articles actually included data publication. The authors found that of 203 empirical papers published, 76 percent published at least some data or code (Figure 1). About one-third of the studies published raw data/code, while two-thirds published final analysis data/code. (Raw data can be more beneficial to other researchers’ work since it often includes more measures than appear in the final analysis.)
Table 1: Journal Policies on Posting Data and Code.1
(Top tier) Economics
(Mid tier) Political Science Sociology Psychology General Science Journals Analyzed 11 23 10 10 10 3 Code/Data required before publication 10 8 8 2 1 3 Code/Data optional/encourages 1 9 0 2 2 0 Raw data must be submitted 10 7 0 0 0 0 Code/Data verified before publication 0 0 3 0 0 0
Note: From a survey consisting of 11 top-tier and 23 mid-tier empirical economics journals as of July 2017.
Figure 1. Share of Studies with Posted Data and Code.
Note: from a survey consisting 11 top-tier and 23 mid-tier empirical economics journal as of July 2017
The chart below shows the rapid growth in the number of dataset published by J-PAL affiliates, by quarter.
Figure 6. Published Dataset (cumulative) by J-PAL affiliated studies
Figure 7. Dataset Storage Location
While these numbers are promising, there is room for growth. Despite journals’ data publication policies, an increasing number of authors are claiming exemptions. From 2005 to 2016, although the proportion of papers with data submitted to the American Economic Review Papers and Proceedings rose from 60 percent to around 70-80 percent, the proportion of papers submitted which received exemptions from the data publication policy rose from 10 percent to more than 40 percent.3
Authors cite confidentiality issues as the primary reason for their inability to publish data, especially for studies that deal with sensitive information. Intellectual property concerns are the second most-cited reason for requesting exemptions to data publication policies.
With these concerns in mind, authors may perceive that the benefits of data publication do not outweigh its perceived costs and risks.
For example, authors may worry that sharing data could result in losing full control of the data , other researchers using the data for similar research when the original author’s paper is not yet published, or perhaps outside parties digging for errors in the data analysis. Private data providers, especially for-profit companies, are often unwilling to relinquish valuable proprietary data to the public out of concerns that competitors might gain from it.
These risks are valid, but can be minimized by managing permission settings for reuse when there are concerns about malicious users, and avoiding misinterpretation by showing transparency in the research methods used.
The benefits of publishing data
There are many long-run benefits to publishing original research data. Open data can increase visibility of the research and number of citations counts. For example, there is some evidence that publishing research articles for open access, rather than behind a paywall, increases citations.4
Similarly, a preliminary paper by J-PAL affiliate Ted Miguel, with Garret Christensen and Allan Dafoe, concluded that papers in top economics and political science journals with public data and code are cited between 30-45 percent more often than papers without public data and code. It is plausible that open data platforms such as the Harvard Dataverse lead to greater visibility for the researcher, as users who browse or download a dataset are likely to see the associated study or paper.
More importantly, open data is a public good. The availability of data benefits not only researchers, but policy partners who supported the studies, students who learn from using the data, and - importantly - the people from whom the data was collected (though much more work is needed to better inform and educate study participants and members of the public on effective use of open data). Even further, open data enables government agencies to use data that otherwise is costly to obtain.
Open data has the potential to generate new ideas and spark new collaborations between researchers and policymakers--but it only serves this purpose when others are actually reusing the data. For example open data becomes a public good when data are reused for:
- Research (reanalysis, meta-analysis, secondary analysis, replication)
- Teaching (curriculum use for presentations and assignments)
- Learning (dataset exploration)
The J-PAL Dataverse, a subset dataverse in the Harvard Dataverse, is an open data repository which stores data associated with studies conducted by J-PAL affiliated researchers.
We collected data from our database in J-PAL Dataverse users using a guestbook to better understand who was accessing this open data, and for what purpose.
Figure 4. Data Users of J-PAL Dataverse.
Note: Data is collected from July 23 to November 26, 2018.
Figure 5. Purpose of Downloaded Dataset
Note: Data is collected from July 23 to November 26, 2018.
I’m a researcher--how can I start publishing my data?
You can get credit for your hard work collecting data, and contribute to the public good, by making data public. It is worth the effort: Researchers and others often do reuse data and appreciate the effort that goes into cleaning it and curating the code.
What are important considerations for researchers before publishing data?
- If a donor is funding the research, what are their data publication requirements? Some may require publication of just the data that are part of the analysis, and some may require all data collected to be published.
- If your dataset includes administrative data from a third-party organization, are there any data user agreements in place (DUA) that prevent you from publishing the data? Could you go back to the data provider and talk about publication? If you are you writing a new DUA at the beginning of a project, can you include a mandate for data publication?
- If your dataset includes survey data, does your informed consent clause allow publication? Who did you tell your survey participants that you would be sharing the data with? How did you tell them their responses would be managed? ICPSR has several good recommendations for informed consent clauses.
- Does your institutional review board (IRB) protocol have stipulations regarding data publication? Did you mention data publication as part of your original protocol? Can you go back to your IRB for approval of data publication?
- Where will you publish your data? Are there associated fees with the repository? Does your donor mandate a specific repository?
- How sensitive is your data? Does your data contain information regarding individuals' financial, health, education, or criminal records? If so, have you considered releasing the data in a restricted repository (similar to ICPSR’s data enclaves) where researchers can only access it through DUAs and additional agreements about usage?
- Have you thoroughly evaluated the risk to participants? What efforts have you made to reduce the risk of identifying individuals in the study? Have personal identifiers been removed from the data? Could someone potentially link several indirect identifiers (such as gender, age, and address/zip code) to identify individual in your study?
- For example, in dataset that contains sensitive information about individuals, there is a tradeoff between utilizability of data and the privacy of human subjects. Protecting individuals should be the main priority.
- Are the data and code clearly labeled and clean? Would a third party be able to review, read, and run your code?
- Have you clearly documented how the data is organized, how it was collected, what particular variables or observations were dropped or cleaned, and how to use the data and run the code?
Researchers should have a clear answer for each question prior to data publication in order to ensure ethical and responsible use.
An increasing number of research and donor institutions have listed data publication as a condition for grant funding.
J-PAL’s data publication policy requires evaluations funded by our research initiatives to share their data and code in a trusted digital repository (more details are in J-PAL's Guidelines for Data Publication).
We’ve worked closely with our affiliates on curating their data and code for publication since our efforts to increase research transparency began in earnest in June 2015. This work includes cleaning code, labeling datasets, ensuring that personal information is removed or masked, documenting metadata, and publishing datasets themselves. The J-PAL Dataverse has the benefit (over a regular website like a faculty page, for example) of assigning a permanent digital object identifier (DOI) to a dataset for consistent citation, and storing the data in perpetuity through consistent URLs.
Tools and resources
J-PAL and our partner organization Innovations for Poverty Action (IPA) have created resources to help researchers publish their data and improve research transparency. IPA’s best practices for data and code management illustrate good coding practices that can be used to help clean and finalize your data and code before publication. J-PAL North America’s data security procedures for researchers provide context on elements of data security and working with individual-level administrative and survey data.
With this in mind, we’re always working on new resources to support research transparency. Have an idea? Email me at krubio [at] povertyactionlab [dot] org.
To learn more about our work to promote research transparency, visit www.povertyactionlab.org/rt.
References:
Galiani, Sebastian, Paul Gertler, and Mauricio Romero. Incentives for Replication in Economics. Tech. rept. National Bureau of Economic Research.
Christensen, Garret, and Edward Miguel. 2018. "Transparency, Reproducibility, and the Credibility of Economics Research." Journal of Economic Literature, 56 (3): 920-80.
Tennant, J.P., Waldner, F., Jacques, D. C., Masuzzo, P., Collister, L. B., & Hartgerink, C. H. (2016). The academic, economic and societal impacts of Open Access: an evidence-based review. F1000Research, 5, 632. doi:10.12688/f1000research.8460.3
1 Galiani, Sebastian, Paul J. Gertler, and Mauricio Romero. “Incentives for Replication in Economics.” SSRN Electronic Journal, 2017, 4. https://doi.org/10.2139/ssrn.2999062. 2 Galiani et. al, 5. 3 Christensen, Garret, and Edward Miguel. “Transparency, Reproducibility, and the Credibility of Economics Research.” Journal of Economic Literature 56, no. 3 (September 2018): 937. https://doi.org/10.1257/jel.20171350. 4 Tennant, Jonathan P., François Waldner, Damien C. Jacques, Paola Masuzzo, Lauren B. Collister, and Chris. H. J. Hartgerink. “The Academic, Economic and Societal Impacts of Open Access: An Evidence-Based Review.” F1000Research 5 (September 21, 2016): 632. https://doi.org/10.12688/f1000research.8460.3.