Imagen


The slinky was originally intended to help stabilize naval equipment. It (un)fortunately didn’t work, and the poor toy was shelved until the creator accidentally knocked it down and realized it “walked” down stairs. While there are many lessons you can draw from this anecdote, including some on the profitability of naval equipment innovation and/or clumsiness, one of the most important is that having access to a tool is not necessarily the same as knowing what to do with it.
In July, we published a blog describing how to access any of the 130+ datasets (and other materials!) from the J-PAL dataverse, our primary location for publishing data and replication packages produced from the randomized controlled trials (RCTs) our affiliated researchers have run over the past twenty years. In this blog, we’re following up with some suggestions on how to use those materials. And, to celebrate the fifteenth anniversary of the J-PAL dataverse, we’re providing fifteen of them!
While we don’t claim comprehensiveness in this list and look forward to being surprised in the future with innovative reuse, we do hope to help display the diversity of possibilities and provide some starting points for new users. We’ll start by giving an overview of our current types of data available before moving into fifteen potential use cases, grouped by overall purpose.
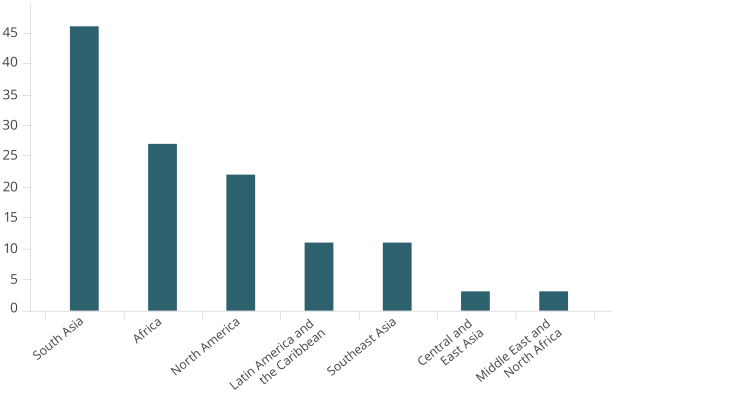
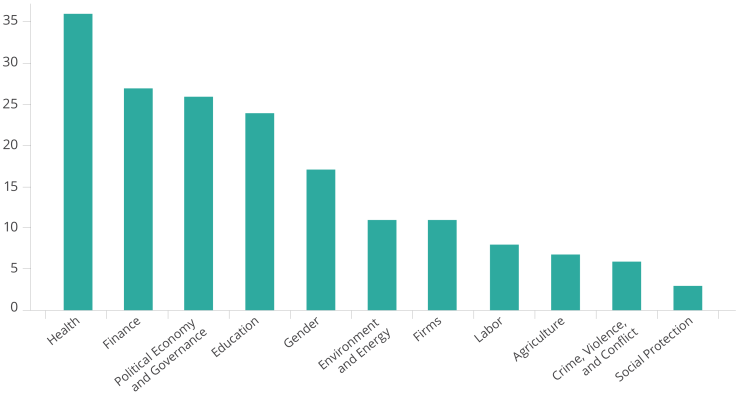
The two graphs above display the diversity of J-PAL’s datasets themselves. The dataverse contains datasets from countries across the globe and covering sectors from health to political economy to labor and firms. With this range in topics and geographies, we imagine that users across the board can find a dataset that’s the right fit for them as they pursue any of the use cases below.
Instructional aids for teachers (1) and learning materials for students (2):
Often the best way to learn something is to do it yourself, and working with data is no exception. From teaching students statistical concepts like estimating a program’s average treatment effects (ATE) or implementing stratified randomization, or giving opportunities to practice more mechanical tasks like data cleaning, the J-PAL dataverse can provide a stable and open source for real-world, high quality data for teaching and learning exercises. An example of this is the code provided as part of our research resource on power calculations, which uses a dataset from an education study to illustrate power calculations using built-in commands or by simulation.
Learn how to do new tasks in an old language (3) or old tasks in a new one (4):
In addition to high quality randomized controlled trial (RCT) data, the entries in the J-PAL dataverse often contain replication code, some in Stata and some in R (see our previous post for tips on finding the right code). Whether it’s learning new methods like analyzing networks or calculating attrition bounds in your primary coding software, or learning how to do a familiar analysis in a new one, the materials in the dataverse can provide cutting-edge coding techniques from which researchers of all experience levels can learn.
Discover better ways to ask the right questions (5) or new questions to ask (6):
Code isn’t the only non-data material found in the dataverse: users can take advantage of the wealth of open access survey instruments in replication packages to both learn how other researchers have asked specific survey questions or to discover other types of questions that have been asked within a broad research topic. Many packages have survey instruments; see the repositories for the Tamil Nadu Aging Panel and the Targeted Unconditional Framed Cash Transfers for Early Childhood Health and Nutrition Outcomes project for a couple of recent examples.
Conduct a push-button (7) or coding-from-scratch (8) replication of a published study:
Open-access replication packages contribute to the goals of research transparency by allowing anyone to attempt to replicate the findings from a paper using the same data and potentially the same code. Push-button replications involve taking the code and data from a paper and making sure that running the replication files reproduce the tables and figures from the paper. From-scratch replications are a bit more involved and require writing your own analysis code based on descriptions from the paper; this takes more work but can also be a great learning exercise (and is a common assignment in graduate coursework). If you would like to learn more about reproducibility or get involved in replications yourself, see the Berkeley Initiative for Transparency in the Social Sciences (BITSS) Guide for Accelerating Computational Reproducibility in the Social Sciences, J-PAL’s pre-publication re-analysis project OSF page, and the Social Science Reproduction Platform (SSRP).
Calculate summary statistics relevant to policy (9) or further research (10) using the high quality data on populations/outcomes that are difficult to obtain through (inter)national surveys.
From the eight uses above, we can see how there is a lot of value to be gained from simply using the materials in published replication packages as pieces of documentation—a veritable treasure trove of supplemental material from research projects to learn from and reproduce. But luckily we don’t have to stop there. The datasets found in replication packages are much more than just static ornaments to a journal publication: they are important descriptors of the population being studied at a point (or more) in time and can be used for more dynamic purposes by both policymakers and researchers.
Policymakers may consult representative datasets of certain populations in order to best understand the needs and resources of their constituents. While periodic data collection representative at the national level is common both within national statistics agencies and through international surveys like the World Bank’s Living Standards Measurement Surveys (LSMS) and the Demographic Health Surveys (DHS), data collected from RCTs can be useful for providing representative data on i) subnational populations of interest, for example those outside of the formal economy like informal rural laborers or those eligible for certain benefits like medicaid-eligible individuals; and/or ii) innovative or difficult-to-measure indicators, like risk preferences and technology diffusion.
RCT data can also be of great use to researchers interested in studying different outcomes but within the same population covered in the data, or in studying the same or similar outcomes in a different (but similar) population. For example, a research team may use consumption measures captured as a covariate in an educational intervention as inputs into a needs assessment for a cash transfer program in the same population. Another team may use baseline data on an indicator unlikely to be found in typical national/international surveys, like engagement with misinformation, to conduct power calculations for a project targeting that outcome (see more in our power resource).
Published RCT data isn’t just good for providing supplemental or starting information for primary data collection, it’s also a great place to start for conducting your own secondary research. Because we couldn’t possibly cover the universe of potential research projects using published RCT data, we’ll cheat a bit and just point to some great examples of RCT data reuse for our last five uses.
Specifically, RCT data has been reused in the past to (11) combine evidence across studies in a meta-analysis of a specific intervention type; (12) study measurement or design features of RCTs; (13) assess estimation and prediction methods; (14) test and develop statistical and machine learning methods; and (15) delve into larger questions of epistemology and research transparency. We’ve tried to give one or two good examples for each of the above, but there’s plenty more great research out there that reuses RCT data. If you’re interested in learning more, we recommend looking through the “Uses of Secondary Experimental Data in Research” section of our paper with Anja Sautmann and Jasmin Fliegner on describing a metadata schema for data from experiments in the social sciences.
In this post we’ve provided fifteen potential uses for the data and materials on the J-PAL dataverse that we hope will kickstart your creativity and inspire many more. The dataverse is meant as a resource for students, teachers, researchers, policymakers, and anyone in between, and we look forward to continue expanding its horizons.