Image

With the end of widespread lockdowns, and as the wait for a vaccine to become widely available continues, the onus is on us as individuals to take precautions and decide on safe actions.
Research on what activities are classified as being ‘safer’ and country guidelines are a helpful starting point, but these are insufficient. Not all situations are documented, and there is significant contextual variation making a “one-size-fits-all” approach infeasible.
Thus, individuals are left to assess the risks and make safe decisions for every activity, whether it be stepping out to the neighborhood café for a cup of coffee, inviting people home to a child’s birthday party, or resuming work in an office space.
To arrive at an answer for each such instance, one should systematically evaluate the circumstances with evidence and data, and use it to address the worrying questions on one’s mind, “Will I get infected? If I do, will I transmit to others? Will I need hospitalization?”
Personal anecdotes, political rhetoric, and sensational media stories reinforce cognitive biases, which may lead to extreme behaviors. Some people may continue to remain at home, as if still in lockdown, in anticipation of spikes in cases and disturbing stories of an overburdened health care system. Others might resume their lives and engage in activities as if the crisis had abated and normalcy was restored.
In order to adopt a fact-based approach to decisions that can help overcome biases, the right data needs to be made available from reliable sources and in a timely manner, such that it allows combining data from different sources for meaningful analysis and interpretation.
J-PAL South Asia’s Innovations in Data and Experiments for Action (IDEA) Lab collaborates with governments, nonprofits, and private data providers to enable greater use of data for decisions by engaging in data use cases and strengthening capabilities to improve quality and use of data for decisions.
Many governments, including in large countries like India, where J-PAL South Asia is based, have deployed digital technologies such as app-based data collection and monitoring technologies in the fight against the pandemic. With the expansion of digitization, data on tests, cases, deaths, and recoveries is publicly available daily in almost real time.
Such data is frequently used to describe current and past trends, but is under-utilized for forward planning and decision making.
For a starting point in the use of data for decisions, one can adopt the principles of a decision framework, which is both a conceptual structure and a way of processing all pertinent information objectively to inform the best course of action given the circumstances.
For decisions at any level, whether an individual, business, or government, there are three natural steps in a data-driven process:
(i) Defining estimating indicators,
(ii) Identifying data sources, and
(iii) Combining data to appropriately estimate and interpret indicators.
In this post, we’ll discuss the decision framework from the point of view of individuals making decisions on undertaking day-to-day activities such as going to a cafe, a salon, or shopping in a mall.
The first step in developing a decision framework is to identify the right indicators.
Indicators are contextually valid metrics that allow us to assess a particular situation. Country or state-level number of cases, deaths, and recoveries are the most commonly used indicators to understand the general trend of the pandemic, but may not be relevant to assess the situation locally in a given neighborhood.
We outline a few indicators below which we believe will help us as individuals assess the local situation and inform personal decisions.
First, we need an indicator for personal risk profile: What percentage of people with similar characteristics, in terms of age, gender, and co-morbid conditions get infected and experience adverse effects of the disease?
We have to estimate this not just for ourselves as individuals (personal risk), but also for those we live with (household risk), since if we get infected when we venture outside, we endanger them as well. This can be estimated using national data on testing, symptoms, behavior, hospitalization, and deaths for persons with similar characteristics to us and our household members.
Next, we need an indicator to assess the health system response of our city: If we or anyone in our homes are infected, how quickly and effectively can the city’s infrastructure respond to a need for hospitalization?
Typically, this indicator includes the time taken between clinical recommendation and actual hospitalization (average time taken for hospitalization and treatment), availability of resources, such as beds, and the receipt of the prescribed care protocol (prescribed medication, oxygen support, or ICU care). To estimate this, city-level data on time to hospitalization, quality of treatment, and availability of hospital resources such as oxygen supply and ICU can be used.
Then, we need an indicator to understand the local situation: How prevalent is the disease in our neighborhoods?
For example, how many people on an average out of, say, 10,000 residents are infected? Have the cases increased or decreased over the past few weeks? This is estimated using neighborhood-level data on cases to estimate prevalence.
Since research suggests that the likelihood of contracting the virus varies in different situations, we need an indicator for disease transmission: In what percentage of cases can the source of infection be linked to places of sustained exposure (household, offices, etc.) or sporadic exposure (restaurants and commercial establishments)?
Similarly to prevalence, neighborhood-level data is useful to estimate the likely source of infection.
Indicators represented as percentages, indices, or scales, rather than absolute numbers, are more helpful since they help compare across situations.
In order to use indicators for a decision, we must estimate value by using reliable data from the right levels.
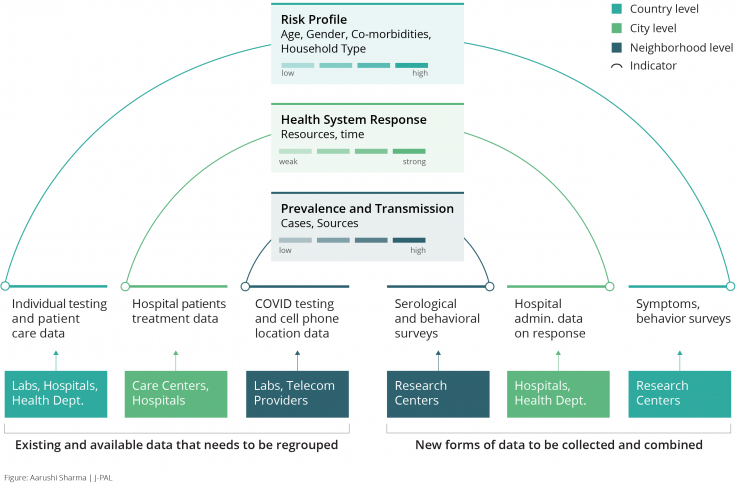
While the framework represented above serves as a thought exercise, it can be operationalized when the right data is available, and when there is potential to collect and combine more data through various sources (see Figure 1).
Several such initiatives are already underway, albeit in silos. For instance, all public and private testing labs in India report on tests and outcomes they carry out; and hospitals, isolation centers, and home isolation monitoring programs keep detailed clinical records on disease progression, treatment, symptoms, and recovery. If collated centrally, this data could be used to estimate individual localized indicators for prevalence and risk profiles.
In addition, central and state government apps in India like Arogya Setu compile information on positive cases, movement of users, and hotspots. Cell phone location data captures information on the movement of users and interaction by location, type of business, and time of day. Such data, in addition to data from serological (antibody) surveys, can be combined to provide estimates of local transmission by type of business and activity.
Household surveys, such as the one conducted in West Bengal by J-PAL affiliated researchers, can provide information on symptoms and health-seeking behavior, adding more nuance to the estimation of risk profiles.
Administrative data on hospital beds and ICU facilities and real-time data on emergency services can be collected and collated from all institutions providing treatment in the city and used to estimate the health system response.
Finally, all the data should be anonymized and organized such that it lends towards group-wise estimation by personal characteristics, community, and city.
Once we have determined what types of indicators to assess, what statistics each indicator consists of, and where to source the data from, it is possible to use such a decision framework for different individuals in different locations to decide how risky it may be to engage in a local activity such as going to a cafe in their neighborhoods and cities (see Figure 2 for an example of two scenarios).
This type of analysis is more personalized and informative than general guidelines, as people are resuming their lives and activities and may not consider more general guidelines to apply to them.
This example showcases these indicators for two similar people in different cities with comparable health systems/responses, different household composition, facing different prevalence rates in their respective neighborhoods.
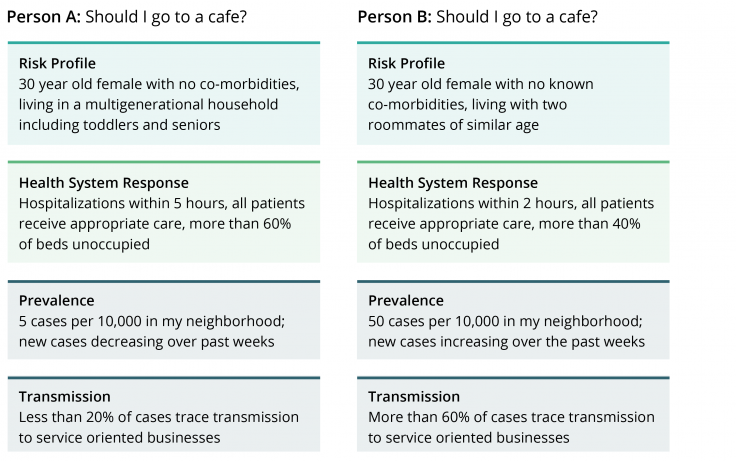
As we can see, the assessment of the riskiness of the activity varies, based on the estimation of each indicator using data from their respective situations.
The final decision should be informed by a cost-benefit analysis: a comparison of the computed risk based on one’s personal and household profiles and type and location of activity, to the perceived benefit from the act of, in our example, visiting a cafe.
Today, app-based solutions, like an indicator dashboard that’s updated in real-time, could easily compute conditional probabilities and statistical modeling. We’ve mocked up an example of what this might look like in Figure 3, though it remains just a concept for now.
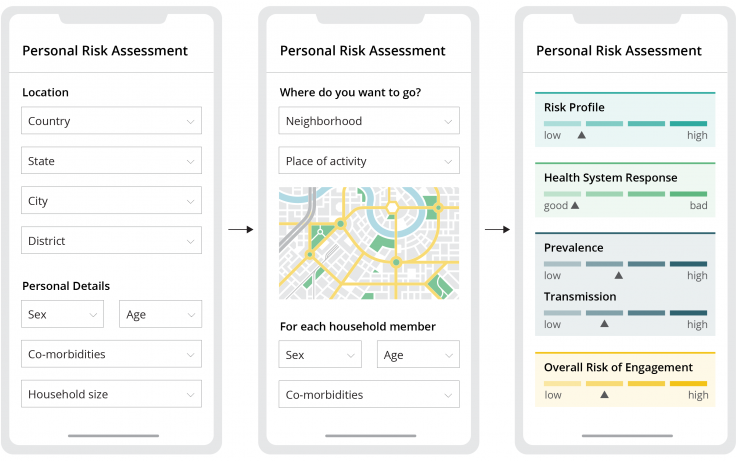
Such apps are meaningful only if all relevant data from different sources are accessible and collated for ease of use, while ensuring appropriate data protection features.
The success of such an initiative eventually depends on its use. There is an urgent need for governments to involve citizens, researchers, and industry leaders in the safe and effective use of data for decisions.
However, even with the right data on smart dashboards at our fingertips, what ultimately matters is nurturing the habit of a data-driven approach to thinking across levels, by individuals and within organizations and governments to reduce our biases and make better decisions.
To enable effective data use over time, much more needs to be done on policies for the protection of sensitive information, guidelines, and protocols for data accessibility and feedback mechanisms into policy decisions. J-PAL's IDEA Handbook on Using Administrative Data serves as a go-to reference, providing rich information, best practices, and case studies of collaborations between data providers and researchers.
To start with, data use cases, i.e. instances of combining and interpreting data for insights into planning and course correction of policy actions, can effectively demonstrate how data can be a decision-making tool. The authors are presently working on a proof-of-concept dashboard to demonstrate this decision framework using publicly available data.
With real-time data, the application of the model could be expanded to inform a wide range of decisions. For example, a city government interested in developing a technical platform could partner with J-PAL’s IDEA Lab to define the right indicators and data sources into a decision framework, operationalize the use of data for decisions such as the opening of schools and running of businesses operations.
Finally, such platforms would enable policymakers to engage with researchers to design and evaluate the impact of a variety of interventions to enable safe resumption of social and economic activities, truly unlocking the potential for innovative use of data for decisions.
Harini Kannan is a research scientist at J-PAL South Asia who focused on research in education and providing M&E advisory to state governments, NGOs, and other social sector organizations.
Aparna Krishnan leads the IDEA Lab at J-PAL South Asia and works with governments on institutionalizing the use of evidence to inform policymaking.