Celebrating a decade of the AEA RCT Registry

By the age of ten Mozart famously had already composed a symphony. While by its tenth birthday last year the American Economic Association (AEA)’s Randomized Controlled Trial (RCT) Registry hadn't quite done that, it did contain over 7,400 registrations from approximately 7,700 PIs and took a major step forward in the ongoing march for greater transparency and credibility in the social sciences; we might be biased, but we think that's equally deserving of prodigy status.
The AEA RCT Registry was founded in 2013 as a collaborative project between J-PAL and the American Economic Association. The Registry serves as a central repository for information on planned, ongoing, completed, or withdrawn randomized trials in the social sciences. Though the primary goals of the Registry are to i) combat publication bias and increase transparency in the social sciences and ii) facilitate meta-analyses (see more in our trial registration research resource), a database of thousands of social science trials can be a fantastic tool for looking into broad trends in social science experimental research.
Today, we celebrate the Registry’s tenth anniversary by doing just that—using the wealth of data (updated every month in the AEA Registry Dataverse) from ten years of registrations to draw out ten new insights from the Registry.
Insights 1–5: A growing Registry
(1) The overall volume of registrations has increased dramatically, and (2) so has the proportion that are pre-registered.
Since its inception in 2013, the Registry has grown to include over 7,400 randomized experiments in over 100 countries. As of 2023, the Registry receives nearly 1,000 new registrations a year, with no sign of plateaued growth yet.
Of those registrations, our second insight is an increasing proportion of pre-registered entries (those registered before their intervention start date).

With just a couple of exceptions, this trend has been consistent since 2013, moving from about 30 percent of new registrations in 2013 to over 56 percent in 2021 and 2022, which could suggest a growing norm of pre-registration in the social sciences. Pre-registration can help improve the credibility of trials by laying out key design and analysis decisions before data is collected/seen. So the rising share of trials that are pre-registered is an encouraging trend.
The geographic diversity of the Registry is also increasing, with continued growth in the number of unique countries with (3) trials and (4) PIs on the Registry. But (5) the vast majority of PIs are still from Europe and North America.
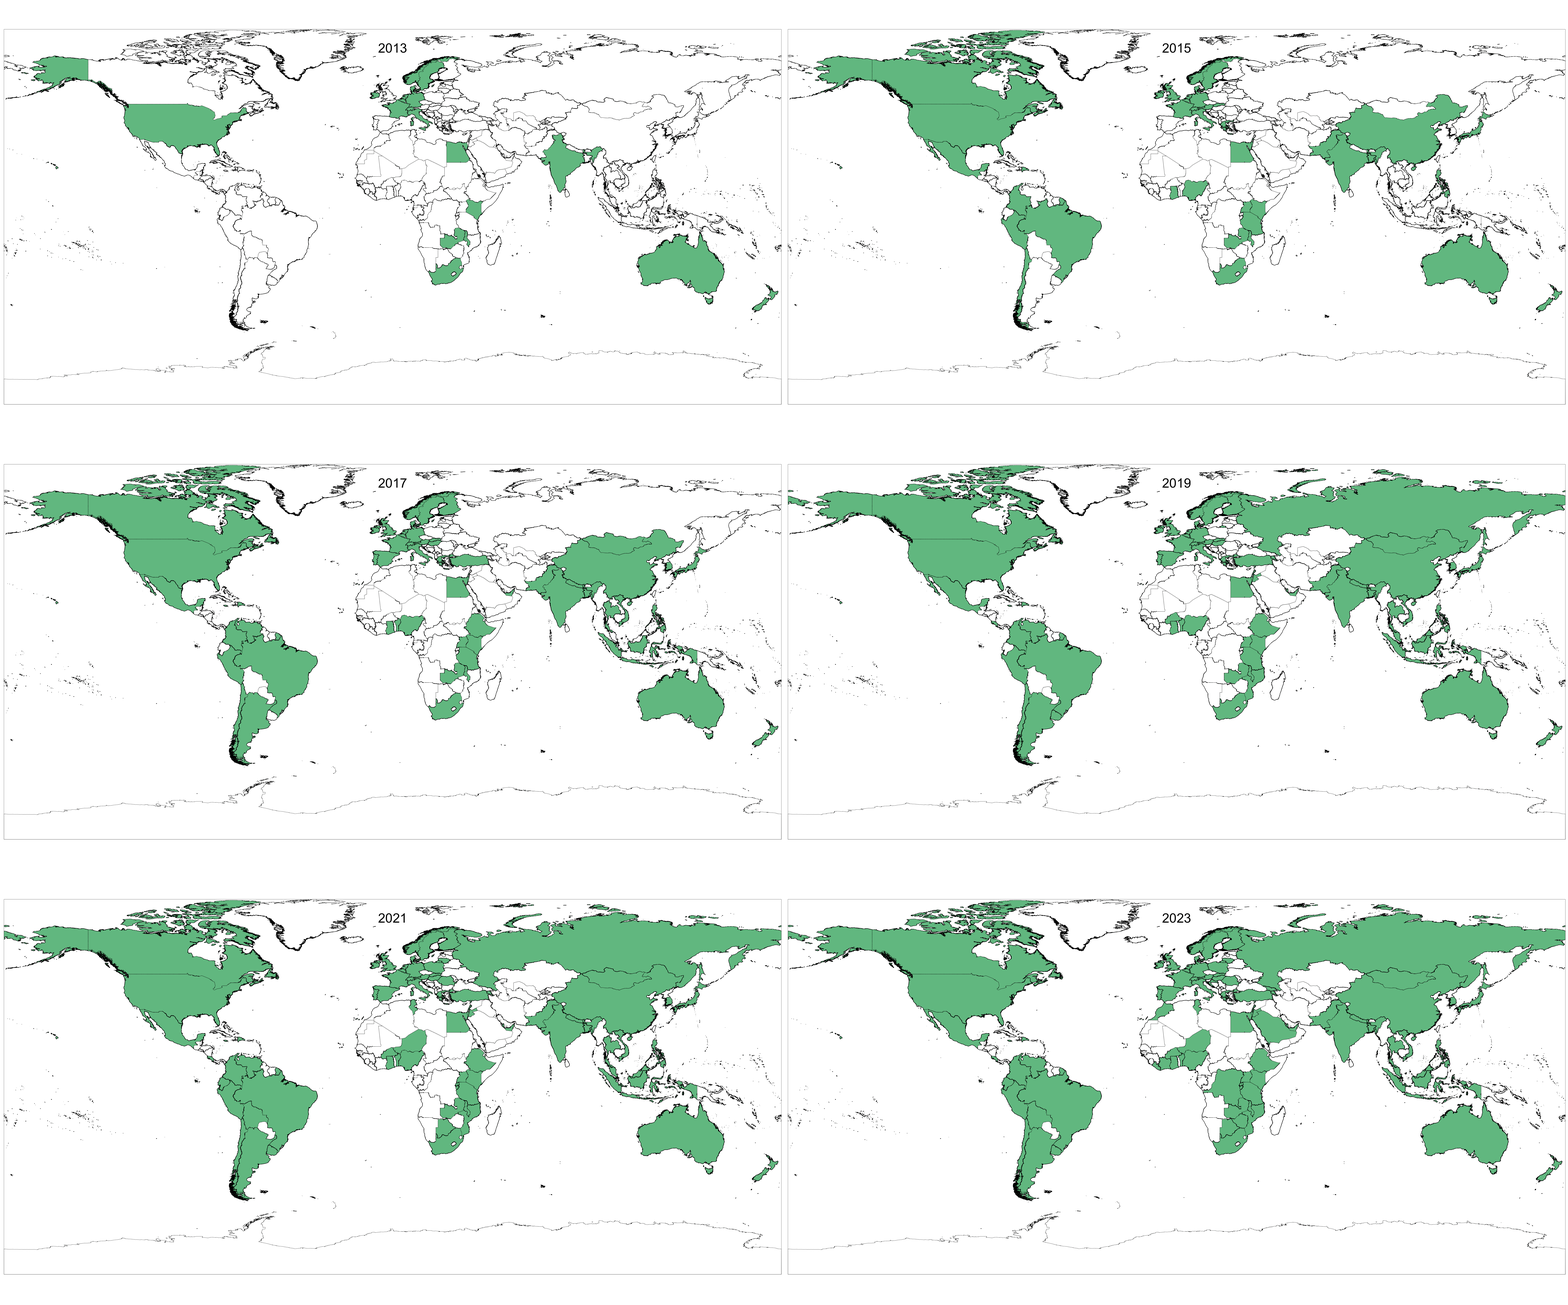
Next, we look into the geographic distribution of both trials (Figure 2) and institutions of principal investigators (PIs) (Figures 3 and 4) over time on the Registry. Both initially show a striking increase in diversity.

In 2013, registered trials represented 21 distinct countries and PIs from nineteen different countries. This nearly doubled the next year to 37 and 34 countries, respectively, and the growth has continued: in 2023, registered trials represented 94 distinct countries with researchers from ninety countries.
Figure 3: Location of PI institutions over time

Zooming into the count of PIs, however, tells a more muted story. From Figure 4 we can see that while the number of PIs from regions other than North America and Europe has increased over time, the vast majority of PIs on the Registry continue to be based at organizations in those two regions.

Insights 6–8: An increase in “behavioral” experiments
(6) Registrations marked as “behavioral” have increased substantially over the past few years; this growth is (7) shared across all topic areas, and (8) not driven by a large increase in lab or survey experiments.
Our next insights focus on the sectoral range of trials on the Registry over time. Figure 5 shows the top-level keyword for trials registered in the AEA RCT Registry from 2013 to 2022. The most prominent feature of the graph is the dramatic rise in the number of trials tagged as focusing on “behavior,” especially from 2019 to 2022.

We explore this further in two ways. First, we check whether this has been driven by a disproportionate increase in behavioral trials in one or two sectors by plotting in Figure 6 the coincidence of other sectoral tags with “behavior” over time. While there are some smaller trends, such as a marked increase in trials marked as both “behavioral” and “gender” in the latter half of the decade, what is most striking is that behavioral trials seem to be increasing across the board, from agriculture to health to education.

We next look to see if the trend is driven by the type of randomized experiment being conducted. While many of the early trials registered on the Registry were field experiments, the Registry also includes randomized lab and survey experiments. Figure 7 shows the proportion of trials that contain text in one of their fields that signals they contain either a lab (or lab-in-the-field) experiment or survey experiment. While we see growing proportions of both over time, they are still a small percentage of the total trials registered.

Insights 9–10: Papers on, about, and using the Registry
(9) The ability to link papers to registrations is underutilized, but we can glean some information from those that are.
While we can see above that registration and pre-registration are becoming larger norms in the social sciences, updating registrations with post-trial information, like the status of the trial and links to any published paper/data, is still relatively rare—as of early 2023, only around a fifth of all trials one year past their registered end date had any post-trial information filled in. However, from the entries that have updated information, we can pull some insights from the linked papers.

We were able to pull information from over 750 papers linked on the Registry. As shown in Figure 6, the majority of those 750 are working papers. From there, we assigned a broad academic field to all published papers and all working papers published through an organization (e.g., NBER Working Papers).
While the vast majority are classified as economics (86.7 percent), there are papers from a wide array of disciplines, including public health (3.4%), political science (2.8 percent), education (2.3 percent), psychology (2.1 percent), sociology (<1 percent), and demography (<1 percent).
(10) We aren’t the only ones using Registry data!
Finally, as the Registry has continued to grow, attract new users, and become a standard for experiments across economics, it is improving in its function as a central database of those experiments. In the last five years, we have seen a marked increase in the number of papers that use the publicly available Registry metadata as either their main analysis data or as a supplement to it. So far, these can be grouped into a few broad sets.
The first, and as expected largest, group are those that use the Registry to study research transparency questions in the social sciences, either studying the Registry as a transparency object in itself (Garret and Miguel 2018; Abrams et al. 2020; Miguel 2021), taking it as a means to glean information on other transparency behaviors (Ofosu and Posner 2018 for pre-analysis plans and Laitin et al. 2021 for results reporting), or finally using it as an auditing tool, both for self-reported data (Garret et al. 2019) and the implementation of transparency policies (Buckley et al. 2022).
Second are studies that use the Registry data as a significant portion of a larger compiled dataset attempting to proxy for the universe of experiments and experimenters in a particular subset of social science research (Corduneanu-Huci et al. 2022 on the location of researchers conducting experiments, and Corduneanu-Huci et al. 2021 on the location and political economy of experiments).
The last group of studies uses the data to answer meta-scientific questions about the studies on the Registry (Leight et al. 2022 on publication bias in RCT research; Murtagh-White et al. 2023 on the possibility of automated evidence aggregation).
Looking forward to the next ten years
While we hope our ten insights were interesting, we only scratched the surface of what’s possible with the Registry data. We look forward to seeing more uses of the Registry data in the future, and more than anything to see how the Registry itself continues to evolve over the next ten years. In the meantime, please continue to register your trials, and use the Registry and its data for finding exciting experiments in your area of interest!
Related Content

Transparent and accessible data: J-PAL alumna collaborated on an innovative approach with the Chilean government and researchers

From RCT data to survey instruments: how to find what you need on the J-PAL Dataverse


