
Image
This blog is a cross-post and was originally published on the What Works Hub for Global Education.
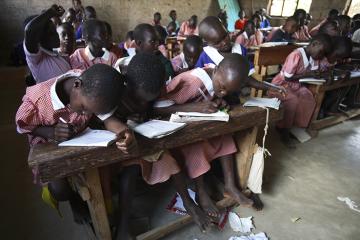
Ensuring children have strong basic skills in reading, writing, and mathematics – together known as foundational literacy and numeracy – is considered critical for their future academic success and later life outcomes. While research has generated insights on what works for improving literacy and numeracy, there is an urgent need to deepen the research on more cost-effective delivery and on how to implement what works sustainably at scale.
The What Works Hub for Global Education is a global partnership focused on implementing and scaling effective foundational literacy and numeracy (FLN) interventions in low- and middle-income countries. As a consortium partner, the Abdul Latif Jameel Poverty Action Lab (J-PAL) is developing tools, including cost-effectiveness analyses and eventually marginal value of public funds analyses, to help policymakers and practitioners make decisions based on rigorous evidence. Cost-effectiveness analysis enables us to compare the impacts and costs of programmes with the same outcome across countries and years. When combined with an understanding of the problem and other contextual factors, such analyses can pinpoint high-value programmes and key outcome drivers for policy action.
In this post, we highlight considerations for implementers and other stakeholders interested in cost-effectiveness analysis. We first discuss considerations for decision-makers seeking to make decisions based on these types of cost-effectiveness estimates. We then share some initial estimates of the impact on child development per $100 spent across a handful of non-representative studies with a variety of priorities. These are the first of a large number of education cost-effectiveness analyses we will be conducting in upcoming years, which will span ages and grades.
Cost-effectiveness analyses can lend insight into what programmes may provide particularly high value for money. However, it is important to be cautious when thinking about the relevance of a given cost-effectiveness estimate in a new context, as these figures are often retrospective. That is, they tell us the cost-effectiveness of a programme that was implemented in a particular context at a particular time point and at a particular scale. Because a programme’s costs and impacts will likely change if implemented in a different context or scale, we discuss here three principles for effectively using retrospective estimates to inform future decisions.
While it is encouraging to see more frequent inclusion of programme cost information in academic papers, this data is still not consistently reported. When it is available, it is often presented as per-child or per-teacher costs with little insight into the breakdown of these costs.
Ideally, papers would include the key cost drivers, together with the number of units of each element and their corresponding unit cost. If data on the number of units and unit costs are unavailable, providing details on the total costs by cost driver – as done in Table 2 of the appendix – can be helpful for estimating what a programme may cost in a new context. J-PAL and our partner organisations offer guidance and cost data collection templates that implementers may find useful for their efforts. This type of detailed breakdown can help decision-makers to better understand the main programme components and think through how the costs of each component may change given price levels in their context, changes to programme design, and other considerations.
Further, it is rare for papers to estimate the financial and opportunity costs incurred by participants. Knowing what kinds of costs participants may incur – or avert – is an important consideration for decision-makers. For example, a programme in India (described below in more detail) provided households with scholarships to attend kindergarten at a particular school. It both reduced tuition expenses for households who would have sent their child to that school anyway and induced parents to send children who otherwise would have attended other schools to the ones covered by scholarships. Detailed analysis of these behaviour shifts was presented in the paper, which – together with assumptions about the costs of alternative school options – enabled us to estimate overall cost savings for parents due to the programme.
Cost analyses can help to lend insight into which of the programmes that accomplish a particular outcome were relatively more cost-effective, but each of these estimates come from a particular context and scale. Policymakers interested in adapting interventions to their context can start with data on cost-effectiveness, but they should also think carefully about the factors that may have driven impacts in the original location and scale to ensure alignment with the needs and realities in their own.
To help facilitate this type of analysis, the ‘Programme & cost details’ section in the appendix discusses important factors that may have been critical for programmatic impact in the original context of the policies considered here. For example, some of the programmes discussed below created new preschools or childcare centres in contexts where such centres were sparse or non-existent. It follows that creating such centres may be less effective – and thus less cost-effective – in a location where such they are readily available, and another constraint primarily drives low attendance and/or take-up.
Once a decision-maker is sure of the type of programme they want to implement, tools like the Generalizability Framework can help them to explore options for adapting its structure to be impactful in a new context. For example, a programme described below provided women with childcare options at their place of work. A policymaker may find that providing similar childcare options at women’s places of work is necessary in their context as well, but they may want to tweak details of the programme’s structure in terms of its pedagogy, hours, types of meals provided, and more to be contextually appropriate.
After determining what a programme’s structure may be in their context, implementers can leverage the detailed cost estimates from the original context to estimate 1) which of the cost drivers remain relevant and 2) what the individual elements may cost based on local prices. From there, implementers can draw conclusions about the magnitude of overall costs and affordability in their context given their budget.
Keeping these three principles in mind, decision-makers can draw on retrospective cost-effectiveness analyses to inform their own decisions. We are sharing here some new initial estimates from J-PAL’s broader effort to develop CEAs of programmes seeking to improve student learning.
The studies analysed below focus on improving children’s development and learning in the pre-primary years. Beyond improving children’s immediate outcomes – such as in emergent literacy, numeracy, communications, problem solving, and others – an enriching and healthy early childhood also has the potential to improve their foundational literacy and numeracy once they reach primary school. For example, a study in Argentina found that primary school students increased test scores by 8% and behaved better when they had received one additional year of preschool. On the other hand, children in Ghana and Peru who had access to high-quality preschool programmes initially improved their pre-literacy and pre-numeracy skills but did not keep those gains one year later. Understanding how to effectively and cost-effectively implement early childhood programmes is critical.
Policymakers seeking to implement such programmes will find that they can also take a variety of forms. We present here an initial subset of studies we have analysed from a larger effort which will span more grades, ages, and intervention types to discuss how policymakers could make sense of their impacts and costs.
The structures and aims of the studies presented here can broadly be categorised into three types of interventions.
Table 1 summarises some basic contextual information, impacts, and costs for each of the policies discussed here, organised by type of intervention. For each programme, the table also highlights the impact on child development per $100 spent, as measured in standard deviations, and it provides information on whether the impacts were statistically different from zero. The information in this table – together with the additional context in the appendix and in Table 2 – can help policymakers to make decisions based on rigorous evidence.
| Intervention type | Programme | Age range (years) | Outcome type | Impact per child (SD) | Cost per child | SD increase in child development per $100 | 90% confidence interval |
| Created new centres | Childcare creation in Burkina Faso | 0-6 | Child development | 0.181 | $71 | 0.26 | (0.13, 0.38) |
| Preschool creation in Mozambique | 3-5 | Child development | 0.37 (per student enrolled) | $100 (per student enrolled) | 0.37 | (0.21,0.53) | |
| Childcare creation in Nicaragua | 0-4 | Socio-emotional learning | 0.38 | $90 | 0.42 | (0.09, 0.75) | |
| Provided subsidies/scholarships for preschool or kindergarten | Kindergarten scholarships in India | 3.5-4.5 | Cognitive development | 0.195 | $117 $64 with household savings[1] | 0.17 0.30 including household savings[1] | (0.07, 0.26) (0.13,0.47) including household savings[1] |
| Preschool subsidies in Uganda | 3-5 | Child development | 0.16 | $103 | 0.16 | (0.06, 0.25) | |
| Preschool subsidies with business-labelled cash transfers in Uganda | 3-5 | Child development | 0.15 | $234 | 0.06 | (0.02, 0.11) | |
| Provided a cash transfer | Business-labelled cash transfers in Uganda | 3-5 | Child development | Not distinguishable from 0 | $129 | Not distinguishable from 0 | (-0.01, 0.15) |
| Bono 10,000 health & education conditioned cash transfer programme in Honduras | 0-5 | Child development | 0.336 | $496 (per child in household receiving transfer) | 0.07 | (0.04, 0.10) |
In most cases, including here, cost-effectiveness estimates will be from a non-representative set of studies, and intervention categories should not be compared against each other. Rather, as discussed above, decision-makers should first seek to understand what factors were particularly important for impact in the original context. For example, the programmes that created new childcare centres and preschools all took place in areas where such facilities were not readily available. By contrast, interventions provided subsidies and scholarships for preschools and kindergartens in areas where such facilities were available but not necessarily affordable. Finally, cash transfers can be effective in contexts where providing households with income support can facilitate behaviour change. A policymaker can conduct a needs assessment to decide which type of intervention would be most appropriate for their context.
Having decided which broad category of interventions is most appropriate, policymakers can use the cost-effectiveness and contextual information in Table 1 and the additional details in the appendix below to determine which of the programmes in the intervention category they would like to adapt to their own context. This process may involve first identifying which programme(s) in that category were most cost-effective and then using contextual information and the aforementioned Generalizability Framework to think through how the programme may need to be modified to be culturally and contextually relevant.
Understanding the necessary modifications will help decision-makers to estimate the magnitude of costs in the new implementation, drawing on cost data from Table 2 in the appendix to determine which cost elements may no longer be necessary. This in turn will offer insights on the programme’s affordability in the new context and on what the cost-effectiveness may be in the new context if impacts were to stay the same.
The studies discussed here are a small subset of a broader, multi-year effort to analyse and publish results from a larger body of studies. We hope this work will help decision-makers to better understand the cost-effectiveness of an enormous variety of approaches to improving child learning.
Further, recognising that cost-effectiveness analysis alone may not capture the full scope of benefits of a given programme, we are also in the process of developing marginal value of public funds estimates that summarise the monetary returns of a programme per $1 spent by the implementer. Because this effort will present results from a more representative sample, our findings will be shared in a synthesis product that highlights the relative returns of different categories of education programmes. We hope these products, together with the approaches discussed above on using cost analysis in decision-making, will help education stakeholders make informed decisions that combine evidence and practical budget considerations.
This section provides an overview of each programme’s design, impacts, and costs, including a brief discussion of mechanism. Details on the number of children reached and costs per child are based on the number of children offered the programme and not based on take-up, unless noted otherwise. To serve as a reference point, we also include data on government expenditures per student.[2] Because data for pre-primary school expenditures is not available, the data shown is for primary school spending. Table 2 provides disaggregated cost information where available.
As discussed above, this information, together with a policymaker’s own insights on the main constraints to child learning in their context, can help them to decide which programme(s) may be suitable for their context and what the magnitude of costs may be.
Simple activities such as reading or singing to children and playing with them are critical components of early childhood stimulation, which can in turn improve the ability of young children to think and communicate more effectively. These three studies created new centres in contexts where institutional childcare and/or preschools were sparse.
Age range: 3 to 5 years
Number of children: Offered to all preschool-aged children in area; impacts and costs estimated based on about 2,250 enrolled students per year
Cost per child: $100 per student enrolled; average government expenditure per student in primary school two to three years after this intervention ranged between $110-$115 per year.
Impact per child: 0.37 (per student enrolled)
Impact per $100: 0.37 SD
Outcome type: Aggregate child development
Measurement tool: Adapted from the Ages & Stages Questionnaires, Teste de Vocabulario por Imagens Peabody and the Early Development Instrument
Save the Children worked with local communities in rural Mozambique to create preschools for children aged three to five years of age. Each school contained two to three classrooms, one lavatory and one playground. A mix of donor support from Save the Children and local community resources facilitated their construction. Children who enrolled in these preschools had 0.37 SD better development outcomes, as measured by cognitive, linguistic, psycho-social and behavioural and physical skills. The intervention may have been effective because it met a clear need: it created preschools in a remote area with very limited educational opportunities, including no easy access to preschools. In addition, it leveraged support from local communities, which helped to increase local buy-in. The main cost drivers were programme staff costs, staff trainings and indirect administrative costs, which together made up 71% of total costs.
Age range: 0 to 6 years
Number of children: 2,202
Cost per child: $71; average government expenditure per student in primary school in the five years prior to the intervention ranged from $110-$170 per year.
Impact per child: 0.181 SD
Impact per $100: 0.26 SD
Outcome type: Child development
Measurement tool: Development Milestone Checklist (DMC III)
Researchers, in collaboration with the Government of Burkina Faso, evaluated the impacts of childcare facilities created for the children of women working on public works projects at their place of work. Children in these centres were aged zero to six years old and received two meals a day, toys and learning materials. Their caregivers received training on nutrition and childcare best practices, and government education specialists and social workers made regular supervisory visits. Gross and fine motor and language skills of the children of women offered access to the centres increased by 0.181 SD. Factors facilitating the programme’s effectiveness likely included 1) ensuring services provided by the childcare centres aligned with Burkina Faso’s broader early childhood development strategy; 2) making the centres readily available by creating the centres at women’s places of work; and 3) aligning their opening hours with the hours of the public works programme. The programme’s costs were made up primarily of instructor salaries (just under 50% of total costs), followed by administrative costs (estimated to be 30%).
Age range: 0 to 4 years
Number of children: 733
Cost per child: $90; average government expenditure per student in primary school three years prior to the start of this intervention was roughly $205 per year.
Impact per child: 0.38 SD
Impact per $100: 0.42 SD
Outcome type: Socio-emotional learning
Measurement tool: Adapted from the Denver Developmental Screening Test
The Inter-American Development Bank created childcare centres called Centros Infantiles Comunitarios in rural Nicaragua, where parents otherwise had limited access to institutional childcare. CICOs used a curriculum created by local practitioners focused on early childhood development and planned activities aimed to improve children’s cognitive, language and socio-emotional development. This in turn improved children’s socio-emotional skills – social interactions, ability to independently dress and eat, imitate others, and more – by a total of 0.38 SD, or 0.42 SD per $100. This programme may have been impactful due to the CICOs 1) meeting a clear need in a context with limited institutional childcare options and 2) incorporating activities with clear goals. The programme cost $90 per child, although disaggregated cost information was unavailable.
Preschools and kindergartens can help support child development through clear curricula and set children up for success in school by providing a classroom-like environment. The three programmes discussed here provided scholarships and subsidies to households to waive or greatly reduce the financial costs associated with sending children to preschool or kindergarten.
Age range: Between 3.5 and 4.5 years
Number of children: 404
Cost per child: $117 ($64 after accounting for household cost savings[3]); average government expenditure per student in primary school in the three to five years prior to this intervention ranged from $150 to $155 per year.
Impact per child: 0.195 SD
Impact per $100: 0.17 SD (0.30 SD after accounting for household cost savings)
Outcome type: Cognitive development
Measurement tool: Modules drawn from tools including the Wechsler Preschool and Primary Scale of Intelligence and the Developmental Indicators for the Assessment of Learning
Hippocampus Learning Centres (HLCs) are private kindergartens in India that provide instruction to children aged between 3.5 and 4.5 years of age. Households received scholarships worth $110 over two years to offset all but about $14 worth of fees and materials. The children in households offered scholarships were 47 percentage points more likely to attend HLCs (and 20 percentage points more likely to attend any kindergarten), which in turn improved their cognitive development (based on ability in reasoning, memory, language, mathematics, creativity and motor skills) by 0.39 SD after two years of kindergarten and 0.195 SD after the end of grade 1. The programme may have been effective in part because it 1) provided a formal and potentially higher-quality alternative to anganwadi centres (which provide supervision but no instruction) and 2) attracted children who otherwise would have stayed home or attended other more expensive kindergartens. In conversations with researchers, we estimate scholarships made up nearly the entirety of programme costs, with targeting costs making up the rest.
Age range: 3 to 5 years
Number of children: 363
Cost per child: $103; average government expenditure per student in primary school four and five years prior to this intervention was roughly $55 and $45 per year.
Impact per child: 0.16 SD
Impact per $100: 0.16 SD
Outcome type: Child development
Measurement tool: International Development and Early Learning Assessment
Ugandan households with young children aged three to five years received subsidies of $116 each that covered one year of schooling at a nursery or childcare centre of the guardians’ choice. The chosen centres were typically preschool nurseries that provided lessons in the morning and supervised play or rest later in the day. Providing these subsidies – which could be used only for childcare – increased children’s enrolment in full-day nurseries and improved their development (based on motor skills, early literacy and numeracy and socioemotional skills) by 0.16 SD. This intervention took place in a context where caring for children took up a substantial amount of guardians’ time and childcare facilities were available but expensive, so these subsidies allowed adults to free up their time for other activities. The fact that these subsidies could only be used for childcare may be important: another similar programme provided an equal value of cash that, as it was labelled as being for business purposes but was in practice usable for any activity, had a smaller average effect on child enrolment in full-day childcare. The cost of subsidies constituted most of the programme’s costs.
Age range: 3 to 5 years
Number of children: 357
Cost per child: $234; average government expenditure per student in primary school four and five years prior to this intervention was roughly $55 and $45 per year.
Impact per child: 0.15 SD
Impact per $100: 0.06 SD
Measurement tool: International Development and Early Learning Assessment
This intervention built on the previously discussed programme in Uganda by both subsidising the cost of childcare for a year ($116 value) and providing households with a cash transfer worth the same amount. As before, households could choose the nursery or childcare centre, which typically functioned as preschools. The cash transfer was intended to help households invest in additional business expenses to improve overall household income, and it had similar effects on child development to providing a subsidy without cash: children from households offered the transfer had 0.15 SD better development (based on their motor skills, emergent literacy and numeracy and socioemotional skills). Policymakers focused exclusively on education may find it more cost-effective to subsidise childcare in contexts where childcare is available, but its costs are an important constraint. The cash transfer and subsidy made up most of the programme’s costs, at 47 and 43%, respectively.
Cash transfers can provide households with the income necessary to take up various activities that may in turn improve well-being. Labelling transfers may provide additional information on what behaviours to take up, while adding conditions directly incentivises households to take up the prespecified behaviours. Here, we analysed one smaller, labelled programme and one large-scale programme conditioned on take-up of health or education behaviours.
Age range: 3 to 5 years
Number of children: 364
Cost per child: $129; average government expenditure per student in primary school four and five years prior to this intervention was roughly $55 and $45 per year.
Impact per child: Impact not distinguishable from zero
Impact per $100: Impact not distinguishable from zero
Outcome type: Child development
Measurement tool: International Development and Early Learning Assessment
This programme provided households in Uganda with a labelled cash transfer for $116 to match the average cost of childcare or preschool for a year. Labelled as a business grant, it aimed to ease women’s credit constraints to increase their income, although 65% of recipients ultimately reported using the transfer to offset some or all childcare expenses. Despite this, households offered cash were less likely to enrol their children in full-day preschool, and their children did not have better development outcomes (as measured by motor skills, early numeracy and literacy and socioemotional development) than the children in households not being offered any intervention. This suggests that education policymakers may find directly subsidising schooling (as in the other two Uganda programmes) or at minimum labelling the transfer as being for education may be more cost-effective when it comes to improving child development. The transfers constituted most of the programme’s costs.
Age range: 0 to 5 years
Number of children: Estimates based on an average of 1.04 young children per household receiving the transfer across 2,137 households
Cost per child: $496 (per child in a household receiving a transfer); average government expenditure per student in primary school in 2010, during this intervention, was roughly $448.
Impact per child: 0.336 SD (per child in a household receiving a transfer)
Impact per $100: 0.07 SD
Outcome type: Aggregate child development
Measurement tool: Ages and Stages Questionnaire
The Bono 10,000 cash transfer programme provided Honduran households with cash transfers valued at about $250 or $500 per year, conditioned on take-up of either health or education behaviours. Households with children aged zero to five years of age received a transfer conditioned on take-up of health-seeking behaviours. Development of children who lived in households receiving these transfers increased by 0.336 SD, based on their skills in communication, gross motor, fine motor, personal-social and problem-solving. The transfer may have been effective due to its focus on young children and links between improved health and child development: a separate analysis showed the programme increased the likelihood of a child’s last health centre visit being for a check-up by 7 percentage points.[4] The transfers constituted most of the programme’s costs.
Table 2 shows the cost breakdowns of each programme.
| Programme | Cost element | Total cost | Cost per child |
| Childcare creation in Burkina Faso | Total cost | $155,493.79 | $70.61 |
| Instructor salaries | $76,787.67 | $34.87 | |
| Weekly supervision visits by education specialists | $3,113.01 | $1.41 | |
| Fortnightly supervision visits by health specialists | $1,556.51 | $0.71 | |
| Snacks for children | $20,753.42 | $9.42 | |
| Trainings for government workers and centre instructors | $6,635.04 | $3.01 | |
| Administrative costs | $46,648.14 | $21.18 | |
| Preschool creation in Mozambique | Total cost | $935,906.68 | $99.83 (per child enrolled) |
| School construction (2 years of costs) | $22,766.31 | $2.43 | |
| Programme staff costs | $343,288.91 | $36.62 | |
| Teacher incentives | $49,209.28 | $5.25 | |
| Trainings | $127,807.45 | $13.63 | |
| Monitoring visits | $44,473.00 | $4.74 | |
| Learning kits | $28,452.85 | $3.03 | |
| Child rights intervention | $5,358.85 | $0.57 | |
| Health interventions | $8,772.25 | $0.94 | |
| Travel and transportation | $13,010.90 | $1.39 | |
| Office supplies and fees | $59,052.89 | $6.30 | |
| Indirect administrative costs | $195,069.84 | $20.81 | |
| Cars (2 years of costs) | $17,085.58 | $1.82 | |
| Motorcycles (2 years of costs) | $7,835.04 | $0.84 | |
| Consultants | $13,723.53 | $1.46 | |
| Childcare creation in Nicaragua | Total cost (disaggregated data unavailable) | $65,730.51 | $89.67 |
| Kindergarten scholarships in India | Total cost | $47,281.79 (not including household savings[5]) $26,015.59 (including household savings4) | $117.03 (not including household savings4) $64.40 (including household savings4) |
| Scholarships to households | $44,427.85 | $109.97 | |
| Targeting costs | $2,853.94 | $47.13 | |
| Costs averted due to switching from other kindergartens | -$21,266.19 | -$52.64 | |
| Preschool subsidies with business-labelled cash transfers in Uganda | Total cost | $83,577.45 | $234.11 |
| Cash transfers to households | $41,440.71 | $116.08 | |
| Subsidies for childcare | $33,778.99 | $94.62 | |
| Administrative costs (estimate) | $8,357.74 | $23.41 | |
| Preschool subsidies in Uganda | Total cost | $37,254.36 | $102.63 |
| Subsidies for childcare | $33,528.92 | $92.37 | |
| Administrative costs (estimate) | $3,725.442 | $10.26 | |
| Business-labelled cash transfers in Uganda | Total cost | $46,948.08 | $128.98 |
| Cash transfers to households | $42,253.27 | $116.08 | |
| Administrative costs (estimate) | $4,694.81 | $12.90 | |
| Bono 10,000 cash transfer programme in Honduras | Total cost[6] | - | $495.53 (per child in a household receiving transfer) |
| Cash transfers to households | - | $346.875 | |
| Administrative costs (estimate) | - | $148.66 |
Childcare creation in Burkina Faso
Ajayi, Kehinde F., Aziz Dao, Estelle Koussoubé, and P. Rita Nikiema. “Who Uses Childcare Centers? Evidence from Burkina Faso.” AEA Papers and Proceedings. May 2024, Vol. 114: Pages 454-458.
Bono 10,000 cash transfer programme in Honduras
Lopez Boo, Florencia and John Creamer. 2019. “Cash, Conditions, and Child Development: Experimental Evidence from a Cash Transfer Program in Honduras.” Economía LACEA Journal, Vol. 19, Issue 2.
Kindergarten scholarships in India
Dean, Joshua and Seema Jayachandran. “Attending kindergarten improves cognitive development in India, but all kindergartens are not equal.” Working paper, July 2020.
Preschool creation in Mozambique
Martinez, Sebastian, Sophie Naudeau, Vitor Azevedo Pereira Pontual. 2017. “Preschool and Child Development under Extreme Poverty: Evidence from a Randomized Experiment in Rural Mozambique.” Working paper.
Childcare creation in Nicaragua
Hojman, Andrés, and Florencia Lopez Boo. 2022. “Public Childcare Benefits Children and Mothers: Evidence from a Nationwide Experiment in a Developing Country.” Journal of Public Economics 212.
Preschool subsidies in Uganda; Preschool subsidies with business-labelled cash transfers in Uganda; Business-labelled cash transfers in Uganda
Bjorvatn, Kjetil, Denise Ferris, Selim Gulesci, Arne Nasgowitz, Vincent Somville, and Lore Vandewalle. “Childcare, Labor Supply, and Business Development: Experimental Evidence from Uganda.” Working Paper, January 2024.
[1] This programme provided scholarships to households whose children attended a particular type of kindergarten. Thus, some households whose children would have attended those or similarly-priced kindergartens saved money due to the programme. We estimated cost-effectiveness of the programme with and without these cost savings. More details on the programme are provided in the appendix.
[2] This data comes from the World Bank’s World Development Indicators, which reports both government expenditure per student as a percent of GDP per capita and GDP per capita. We used this data, adjusted to 2020 US Dollars, to estimate per-student primary school expenditure. Due to both gaps and fluctuations in the data, we are generally presenting a range of estimates from within five years of each programme.
[3] Households who switched from sending their child to a more expensive kindergarten to HLCs and households where children would have used an HLC even without the scholarship saved money due to the scholarship, although total savings were offset in part by the additional expenses incurred by households who switched from sending their child to an Anganwadi centre to an HLC. On average, savings per child came to $52.64.
[4] Benedetti et al. 2016
[5] Households who switched from sending their child to a more expensive kindergarten to the ones covered by scholarships (HLCs) and households where children would have attended the HLCs even without the scholarship saved money due to the scholarship, although total savings were offset in part by the additional expenses incurred by households who switched from sending their child to an Anganwadi centre to an HLC. On average, savings per child came to $52.64.
[6] Because this was a large-scale programme, we present costs per child in households eligible for the cash transfer, rather than total costs.