Image


In a world with limited resources, program impacts are just one of several considerations for those interested in evidence-based policymaking. High on the list of other considerations are, among others, the cost of the program, as well as its cost-effectiveness. Comparing the cost-effectiveness of different programs with similar goals can offer insights into which programs are likely to provide the greatest value for money. While a cost-effectiveness analysis (CEA) may not, by itself, provide sufficient information to inform all policy or investment decisions, it can be a useful starting point for governments, donors, program implementers, and researchers when choosing between different programs that aim to achieve the same outcome.
When we present a comparative CEA for improving student learning, however, we often get quizzical looks in response to the following graph:
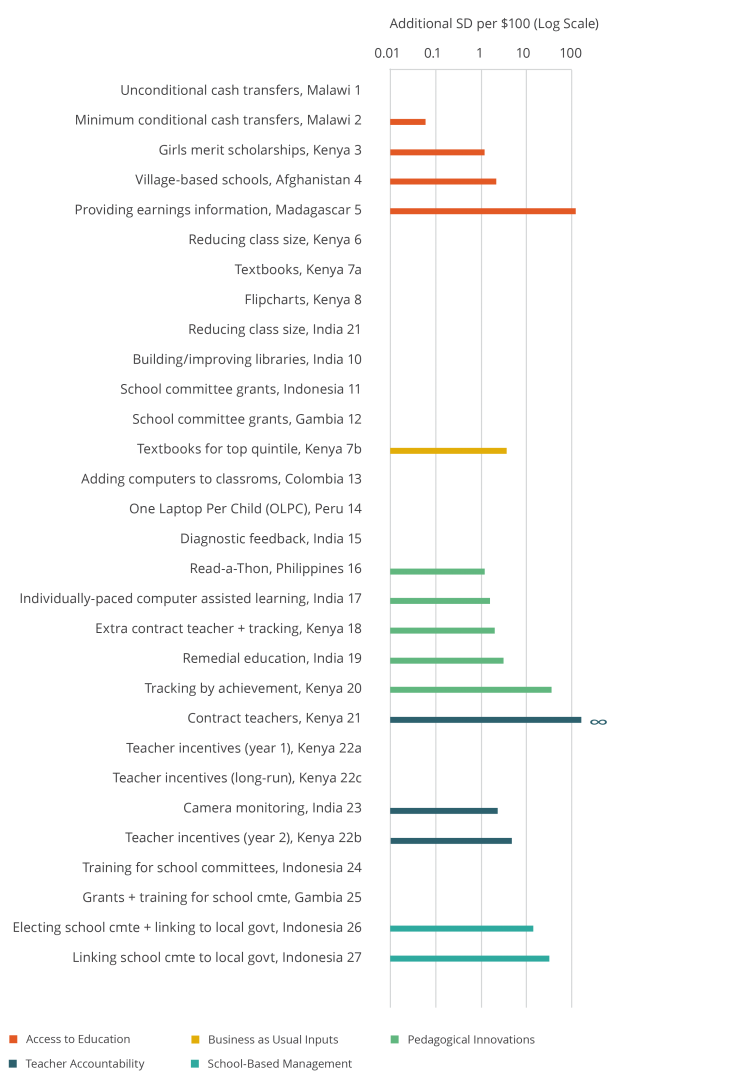
The graph shows an analysis of 27 education programs for which we had cost data. But how should we interpret the results?
First, we should interpret the analysis in terms of the relative rankings of categories, rather than the specific ratios associated with any given program. For instance, the graph indicates that pedagogical innovations are more cost-effective than providing “business as usual” inputs.
Second, we should make note of the units: additional standard deviations per US$100. An impact expressed in standard deviations shows how far a program shifts the average test score in the treatment group within the distribution (spread) of test scores in the comparison group.
It can be easier to understand through percentiles: for example, assuming a normal (or “bell-shaped”) distribution, a 0.2 standard deviation improvement in a student’s test score would move the child from the 50th to the 58th percentile. While far from a perfect measure, standard deviations are commonly used in the economics of education literature because they allow for comparisons between testing outcomes that differ widely in subject matter, context, numerical scale, and more. (To address the challenges of using standard deviations in education research, J-PAL, in partnership with the Center for Global Development, has begun a project to improve the measurement of learning outcomes—more to come soon!).
Looking at the chart above, we see that most cost-effective programs achieve learning gains of 0.1-10 standard deviations per US$100—but the contract teacher program in Kenya stands out with an infinite increase (∞) per US$100 spent. How can a program be infinitely cost-effective?
When we break down a CEA into its component parts, costs and impact, it’s clear why we get this result. The cost-effectiveness of a program is equal to the total estimated impact of the program across all participants, divided by the total cost of the program for all participants, or
| Cost-effectiveness ratio = | Total impact of program on specific outcome |
| Total cost of implementing program |
Now, imagine a new program actually saves the implementing organization money when compared to “business as usual” operations—for example, by reducing the materials required to run the program or increasing its efficiency. In that case, the cost of implementing the program is $US0.
The contract teacher program in Kenya provided funding for primary schools to hire a local contract teacher to address classroom overcrowding. Contract teachers are often paid only a fraction of the salary of civil service teachers. If we assume the contract teacher is used to replace a civil service teaching position, the intervention, in principle, saves money. There are, of course, many reasons why policymakers would not want to replace civil service teachers with contract workers.
Because the program in Kenya also had a significant impact on test scores, the cost-effectiveness ratio looks like this:
| Cost-effectiveness ratio = | Total impact of contract teachers on test scores |
| US$0 |
We’ll spare you the intricate math details, but when you divide something by zero, the answer is always infinity. In other words, any program with a statistically significant positive impact that saves money compared to the status quo will be infinitely cost-effective. In Kenya, by improving test scores while saving money, this program yields an infinite cost-effectiveness ratio. Of course, the program is not infinitely scalable, so in practice possible cost savings from the intervention are finite. Infinite cost-effectiveness is a somewhat theoretical point, but provides more clarity than using negative costs to represent cost savings. If one used negative costs, this would make for a negative cost-effectiveness ratio and it would be unclear if the program had positive or negative impacts.
This example got us thinking about a number of common misconceptions related to J-PAL’s comparative CEAs and their relevance for policymaking. We’ll discuss some of these below, but more detailed information about J-PAL’s CEA methodology can also be found on our website or in J-PAL’s CEA methods paper.
When used correctly, comparative CEAs can inform larger policy discussions about smartly leveraging limited resources to achieve a particular outcome.
Like all program impacts, CEAs must be interpreted in light of the local context.
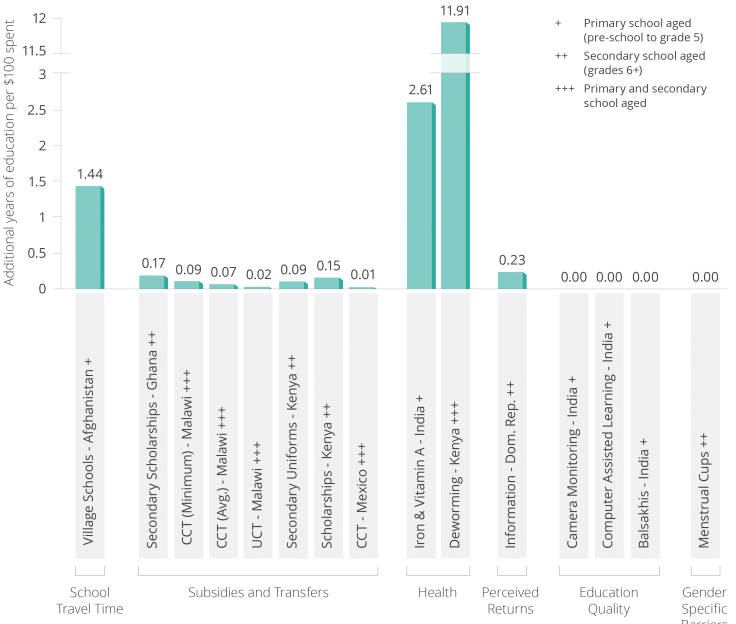
A clear example of this concept comes from deworming: J-PAL calculated that mass school-based deworming in Kenya increases the average student’s education by 11.91 years per US$100 spent. This finding makes deworming very cost-effective compared to other interventions to increase student attendance (see Figure 2 for our comparative CEA on student participation below or on page 25 of our Roll Call Bulletin).
However, we must keep local context in mind. Deworming would not be a cost-effective intervention in an area where there is a low prevalence of intestinal worms because the impact or effect of the program would likely be lower than in a context with a high prevalence of worms. Similarly, an information campaign about the returns to education may not be as cost-effective as other programs such as subsidies or transfer programs in contexts where students already have accurate information about the value of attending school.
CEAs do not monetize the impacts of a program. This allows us to compare interventions without imposing our own value judgments about the importance of different outcomes.
In our learning outcomes CEA (Figure 1), for instance, we can compare computer-assisted learning and camera monitoring of teachers based on their impacts on test scores, without deciding how many dollars a one standard deviation improvement in test scores is worth. Instead, policymakers can determine this value for their specific context and based on their own goals and priorities. By not monetizing outcomes and making these value judgments, CEAs can be flexible tools for diverse audiences.
To maintain this flexibility, CEAs are unable to capture all benefits of a particular program. Instead, they compare interventions on a single common outcome.
For example, conditional and unconditional cash transfers for adolescent girls in Malawi are included in our comparative CEAs on both learning outcomes and student participation. The cash transfers had additional impacts such as decreased HIV prevalence among adolescent girls. While not reflected in the comparative CEAs, reducing HIV prevalence may be an important result for some policymakers, donors, or practitioners.
One way to mitigate this concern is to indicate when a program in a comparative CEA has multiple impacts either in the graph or an accompanying table. By flagging multiple outcomes and not monetizing impacts, we can better acknowledge the tradeoff between maintaining flexibility and capturing all the benefits of a program.
To be sure, policymaking is dependent on a number of critical factors such as context, policy priorities, and holistic program benefits. However, comparative CEAs can be a useful input into complex policy discussions because they allow us to compare different programs evaluated in different countries in different years. When done at a highly disaggregated level and carefully interpreted, CEAs can offer a high-level picture of effective and cost-effective programs. Sensitivity analyses can also be used to adapt cost-effectiveness estimates based on local factors and consider more prospective estimates in a new context or at a new scale.
In short, there are no quick answers: we cannot simply look at a comparative CEA, choose the highest bar, and determine that the program should go to scale. We must interpret comparative CEAs with care to determine how lessons from the global body of research may apply to specific policy debates. In doing so, we can smartly leverage limited resources to alleviate poverty.