


Information to Increase Fuel Efficient Car Purchases in the United States
- Rural population
- Urban population
- Pollution
- Climate change mitigation
- Digital and mobile
- Information
Gasoline-powered cars are major sources of carbon emissions driving climate change, and buying gas can be expensive for drivers. Yet, drivers continue to purchase vehicles with low fuel efficiency. Researchers studied the impact of providing information about fuel costs on consumers’ car purchases. Providing information about fuel costs had no effect on the fuel efficiency of the vehicles consumers chose to buy.
Policy issue
The transportation sector is responsible for 23 percent of greenhouse gas emissions globally.1 As of 2019, only around 3.6 percent of the energy used for transportation was renewable, a much smaller share than other high-energy sectors such as heat and electricity.2 The majority of vehicles run on gasoline, which releases large amounts of carbon dioxide and hazardous air pollutants when burned, making fuel conservation especially important in transportation.3
Fuel-efficient cars allow drivers to drive farther while using less gasoline, generating fewer emissions than more fuel-intensive vehicles in addition to allowing drivers to save on gasoline costs. However, many drivers are not aware of the benefits of fuel efficiency in a vehicle. Research suggests that lacking information about fuel efficiency may systemically bias drivers against buying fuel-efficient cars, not only making consumers worse off but exacerbating the environmental damages associated with high fossil fuel use. Can providing information about the benefits of fuel efficiency lead consumers to buy more fuel-efficient vehicles?
Context of the evaluation
The United States is the second-highest polluting country worldwide and was responsible for around 15 percent of all greenhouse gasses emitted globally in 2012.4 Approximately 15 percent of emissions in the United States were generated by passenger cars in 2020.5 The United States has introduced standards to regulate the fuel efficiency of new cars produced in an effort to reduce carbon emissions. Although information on the environmental effects of carbon emissions is widely available, drivers often buy vehicles with low fuel efficiency.
In collaboration with several car dealerships, researchers ran two information campaigns, one that took place in person and one that took place online. Prospective car buyers at Ford dealerships in seven cities in the United States, Baltimore, Broomfield, Chattanooga, Naperville, North Hills, Old Bridge Township, and Pittsburgh participated in the in-person campaign. Participants in the online survey reported that they intended to purchase a car within six months. In total, 1,989 people participated in the in-person campaign, and 6,316 participated in the online campaign. Sixty-four percent of in-person participants and 60 percent of online participants were men, compared to 48 percent of new car buyers in the United States. Online participants earned around US$39,850 on average more annually than the average income of new car buyers in the United States (US$82,080). In-person participants earned around US$8,570 less than the national average. The average fuel efficiency of the participants’ current vehicles in both campaigns was similar to the national average.
Customers received the in-person campaign between December 2012 and April 2014. Researchers followed up with participants between August 2013 and September 2014. The initial online campaign took place in March 2015, with follow-ups between July and November 2015, and September 2016.
Details of the intervention
Researchers conducted a randomized evaluation to test the impact of providing information on the benefits of fuel efficiency on consumers' car purchases. The evaluation consisted of an online campaign and an in-person campaign delivered at Ford dealerships. The intervention was delivered in the same structure online and in person. Each began with a survey, followed by fuel efficiency information.
In-person Dealership Intervention
Seven Ford dealerships across the United States participated in the dealership portion of the intervention. Participants answered questions about the brand, model, and year of their current car, as well as about the top two cars that they considered buying. Customers also reported on their current fuel costs, and how far along in the purchasing process they were.
Upon completing the survey, participants were randomly assigned to one of two groups:
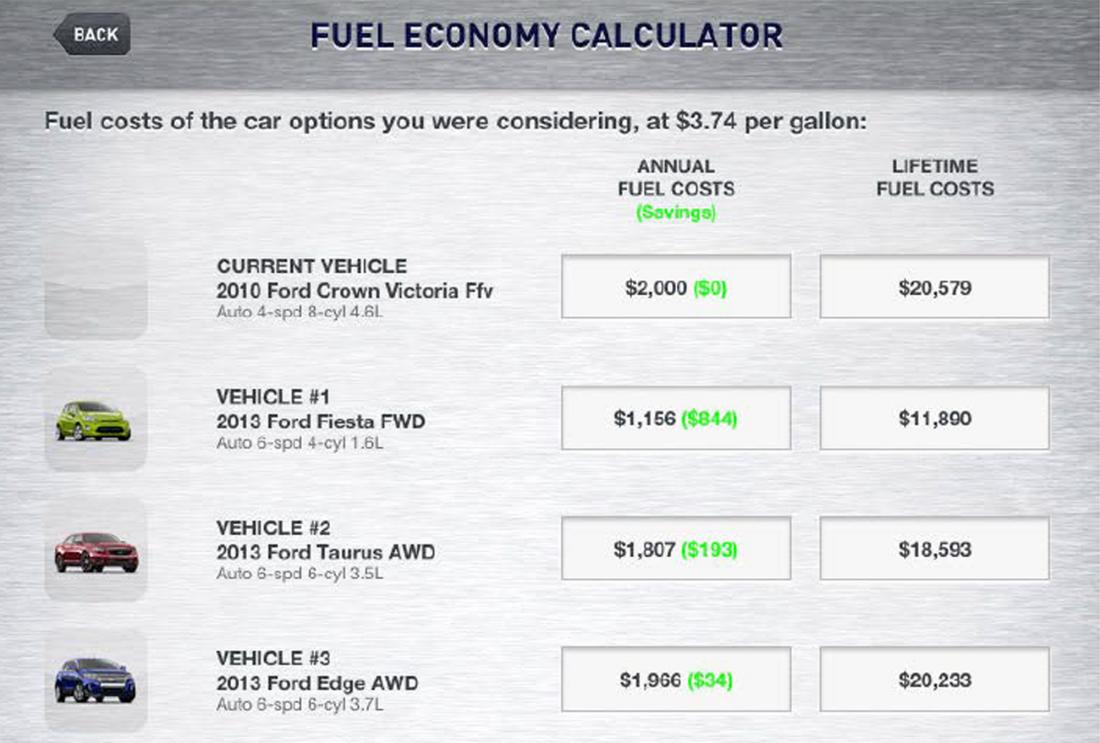
- Fuel efficiency information group (958 people): Customers received information about how far the cars that they were considering can travel using a single unit of gasoline, measured in miles per gallon. Customers went through a series of informational graphics showing how fuel efficiency reduces fuel costs the most among vehicles with low fuel efficiency. They also received information about the estimated annual and lifetime fuel costs of different car models that customers considered purchasing, and comparisons between fuel savings and tangible everyday purchases, such as vacation tickets, clothing, and smart tablets.
- Comparison group (1,031 people): Customers in the comparison group did not receive any additional information after completing the survey.
Online Intervention
Participants in the online survey answered the same questions as participants in the in-person survey at car dealerships. They also answered additional questions about the importance of different vehicle attributes when purchasing cars, and their likelihood of purchasing their first versus second choice car. Of the people who identified that they were interested in buying a car in the online survey, 5,014 randomly received one of five information sets:
- Fuel Efficiency Information Group: Participants received information about how far the cars that they were considering could travel using a single unit of gasoline. They also saw informational graphics showing how fuel efficiency reduced fuel costs, the estimated fuel costs of different vehicle models, and comparisons between fuel savings and tangible everyday purchases.
- Relative Fuel Savings Group: Participants received fuel efficiency information in addition to information comparing predicted yearly fuel savings for each vehicle based on the participant’s self-reported weekly mileage, and compared them to the United States national average mileage.
- Climate Impact Information Group: Participants received fuel efficiency information in addition to information comparing the social damages from carbon emissions for each vehicle the participants were considering.
- Full Efficiency + Savings + Climate Group: Participants received fuel efficiency information in addition to information on both relative fuel savings and social damages from carbon emissions for the vehicles they were considering.
- Comparison Group: Participants received information that was unrelated to fuel efficiency, such as information on car and other vehicle sales, or average annual miles traveled for all vehicles.
Results and policy lessons
Receiving information about fuel efficiency had no effect on the fuel efficiency of vehicles purchased by participants. Consumers reported that they were slightly more likely to purchase the most fuel-efficient car that they were already considering buying prior to the intervention. However, consumers also rated fuel efficiency as a less important attribute of what they look for in a car in general, after receiving the information.
Stated Preferences: Consumers in the Fuel efficiency, relative fuel savings, climate impact, and fuel efficience+savings+climate information groups in the online campaign reported slightly preferring the higher efficiency vehicles that they were already considering purchasing. However, providing information reduced the importance consumers placed on fuel economy. Participants in the online experiment who received the information ranked fuel economy 0.56 points less important on a 10-point scale than those who did not. Participants in the online campaign who received any of the information groups valued fuel efficiency improvements of five miles per gallon at US$371.82, US$92.18 below the comparison group’s valuation of US$464. The information had no lasting effect on participants’ stated preferences 18 months after participants received the information campaign.
Vehicle Purchases: Participants did not change their purchasing decisions as a result of either the online or dealership intervention. Consumers who were less certain about what vehicle they wanted, had spent less time researching, were considering cars with a wider range of fuel efficiencies, or made their purchases sooner after the intervention, were no more likely to change their purchases than consumers who were more certain about their decisions. Participants who learned about the social damages from carbon emissions purchased slightly more fuel-efficient cars. However, comparing participants’ fuel use to the United States average had no effect on their purchasing decisions.
Providing information to consumers may have had little effect because consumers may have forgotten the information they received in the interventions. They may also have been unable to interpret or use the information when making purchasing decisions. Results also suggest there are other factors besides a lack of information in the vehicle market affecting consumers’ decisions. Further research could address other factors affecting consumers’ purchasing decisions, and inform more efficient fuel use policies.
IEA, Global energy-related CO2 emissions by sector, IEA, Paris https://www.iea.org/data-and-statistics/charts/global-energy-related-co2-emissions-by-sector
“The Sustainable Development Goals Report” United Nations. 2022 https://unstats.un.org/sdgs/report/2022/The-Sustainable-Development-Goals-Report-2022.pdf
“Gasoline explained” United States Energy Information Administration. Updated June 9, 2022. https://www.eia.gov/energyexplained/gasoline/use-of-gasoline.php
Hannah Ritchie, Max Roser and Pablo Rosado (2020) - "CO₂ and Greenhouse Gas Emissions". Published online at OurWorldInData.org. Retrieved from: 'https://ourworldindata.org/co2-and-other-greenhouse-gas-emissions' [Online Resource] see chart “What share of global CO2 emissions are emitted by the country? United States:” https://ourworldindata.org/co2/country/united-states#what-share-of-global-cumulative-co2-has-the-country-emitted
“Fast Facts on Transportation Greenhouse Gas Emissions.” EPA. Environmental Protection Agency, July 14, 2022. https://www.epa.gov/greenvehicles/fast-facts-transportation-greenhouse-gas-emissions.