Using evidence to improve open government initiatives
This post first appeared on the Open Government Indonesia blog.
The Open Government Partnership has a simple but powerful goal: for governments to truly serve and empower their citizens. To this end, each participating government partners with civil society to promote transparency, empower citizens, fight corruption, and harness new technology to improve governance.
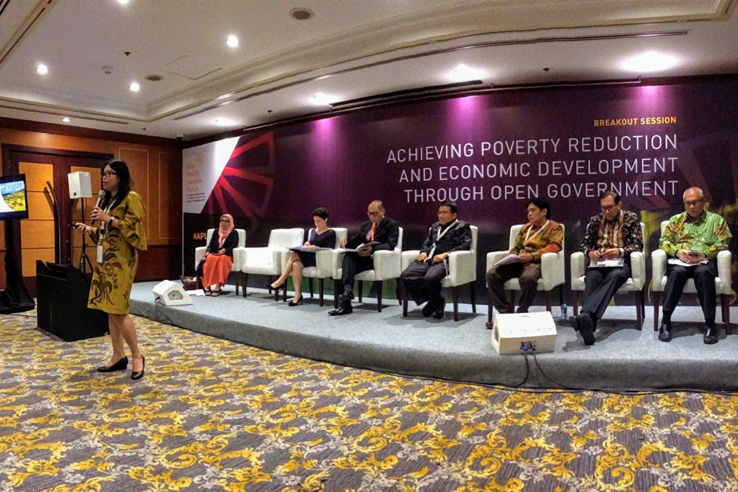
On December 14, 2017, at the Asia Pacific Leaders’ Forum on Open Government, J-PAL Southeast Asia (SEA) co-hosted a session on achieving poverty reduction and economic development through open government. The goal of the forum was to convene leaders in government, business, civil society, and development to discuss linkages between open and responsive government and inclusive development.
J-PAL SEA Executive Director Lina Marliani shared examples from J-PAL affiliated researchers’ work to highlight how randomized evaluations can be used to inform open governance programs. At J-PAL, our network of affiliated professors specializes in this type of evaluation to answer critical questions in the fight against poverty. The main purpose of using randomized evaluations is to determine whether a program has an impact, and more specifically, to quantify how large that impact is. The following examples help to illustrate how promoting transparency, citizen participation, and accountability can lead to improved service delivery and, in turn, development.
Making information transparent can improve service delivery
One way that open government initiatives can improve service delivery is through increasing transparency—for instance, by providing information about social programs and citizens’ eligibility and rights under such programs.
In Indonesia, the Raskin (Rice for the Poor) program provides 15 kg of subsidized rice each month to the country’s poorest households. Despite being Indonesia’s largest social assistance program, with a budget of over US$2 billion per year, Raskin suffers from leakages and targeting issues—rice often disappears on the way to the village or ends up in the wrong households. J-PAL affiliated researchers partnered with the National Team for the Acceleration of Poverty Reduction (TNP2K) to test a new design of the identification cards citizens use to access Raskin—printing the price and the amount of rice to which beneficiaries are entitled on the cards themselves.
Overall, the cards led to large increases in the subsidies eligible households received, likely because cards gave them more bargaining power with the local officials who distributed rice. This illustrates that even in major, long-running programs, information about citizens’ rights may be scarce. In such contexts, providing information—a very simple solution—can be a powerful tool to improve service delivery. Based on this evidence, TNP2K decided to scale up ID cards nationwide and expanded their coverage to include additional safety net programs, reaching over 65 million people.
Citizen participation in decision-making processes can improve satisfaction
In recent years, a growing number of countries have decentralized decision-making power over service delivery to local governments. Through decentralization, policymakers hope to better align new projects with community needs and preferences. However, there is concern that these processes may simply empower local elites at the expense of ordinary citizens. An alternative to having elected representatives make funding decisions is direct democracy: allowing citizens to participate directly in decision-making processes.
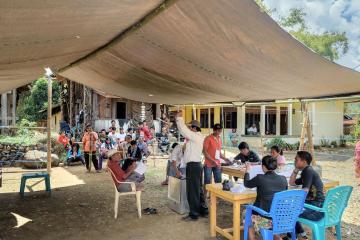
To examine these issues, researchers, in partnership with the Government of Indonesia, studied citizen participation in the Kecamatan Development Program (KDP), which provides grants for local infrastructure projects to approximately 15,000 villages each year. In the study, villages were assigned to choose projects either through direct voting or a representative-based community meeting. In direct voting, villagers selected among the proposed projects by voting in a local election. In the community meetings, representatives from each neighborhood of a village selected projects at local meetings.
Results indicate that citizen participation can substantially improve satisfaction with the political process and access to services. Choosing local infrastructure projects by direct voting, rather than through representatives, had a small effect on the types of projects selected but a much larger impact on citizen satisfaction. Turnout for direct voting was high at 80 percent, as was satisfaction with the projects and the selection process. Citizens in villages with elections were also more likely to know about the projects and to express willingness to contribute to them.
Technological innovations can improve accountability and reduce leakages
Each year, governments spend significant resources on social assistance programs. Yet, much of this money may not reach its intended recipients, due to corruption, mismanagement, and other forms of inefficiency. Innovations in technology can improve governance by reducing opportunities for corruption and leakages. Similar to transparency, however, political economy factors are important to consider when implementing interventions aimed at reducing corruption.
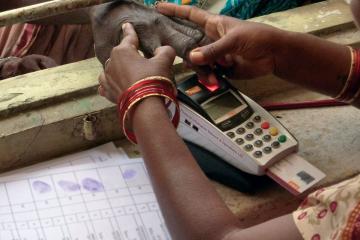
In 2006, the Government of Andhra Pradesh introduced India’s first large-scale biometrically authenticated payment system. Researchers partnered with the government to assess whether the introduction of electronic “Smartcards” reduced leakages in the delivery of two social assistance programs.
They found that introducing Smartcards reduced corruption and substantially improved the delivery of government social assistance programs. The system improved the payment process by reducing payment delays and unpredictability. Furthermore, beneficiaries of both social programs received more money, but official disbursements did not change, implying a reduction of more than 40 percent in leakages in both programs.
Across these examples, we see that providing information, encouraging citizen participation, and leveraging technology can improve transparency and accountability and, by extension, public service delivery. These are just a few examples from numerous evaluations that shed light on how evidence can inform open government initiatives across the Asia Pacific region and beyond.
An increasing number of low- and middle-income countries have delegated decisions about infrastructure projects to local governments. One concern about this trend, however, is that the process may simply hand control of these decisions to local elites, ignoring the wishes of the majority of citizens. An alternative to having elected representatives make these decisions is direct democracy: allowing citizens to participate directly in the decision-making process. To examine these issues, researchers randomly assigned 49 villages in Indonesia to choose local infrastructure projects through either a direct election or a representative-based meeting. Choosing local infrastructure projects by direct election, rather than through representatives, had a small effect on the types of projects selected but a large impact on citizen satisfaction.
Policy issue
An increasing number of low- and middle-income countries, from Brazil to India to Indonesia, have delegated decisions about infrastructure projects to local governments. Through decentralization, policymakers hope to align new projects more closely with community needs and preferences. One concern about this trend, however, is that the process may simply hand control of these decisions to local elites, ignoring the wishes of the majority of citizens.
An alternative to having elected representatives make these decisions is direct democracy: allowing citizens to participate directly in the decision making process. Proponents of direct democracy argue that it may allow citizens to bypass elite-controlled government institutions. Moreover, broader participation may enhance the perceived legitimacy of the final outcome, regardless of which projects are selected.
Context of the evaluation
The villages in the study participated in the Kecamatan Development Program (KDP), a national government program in Indonesia funded by a World Bank loan. KDP uses a three-step process to allocate grants for local infrastructure projects to approximately 15,000 villages per year. In the first stage, meetings at the hamlet level generate lists of proposed projects. (A typical village is subdivided into two to seven hamlets.) In the second stage, the village as a whole selects one general project, originating from meetings open to all, and one women’s project, originating from meetings open only to women. Finally, at an intervillage forum, representatives of all villages in the kecamatan (subdistrict) rank the village-level proposals, awarding KDP funds to projects down the rank-ordered list until the funds are exhausted.
Details of the intervention
The policy experiment took place at the second stage of the KDP process, the selection of village-level proposals. Forty-nine villages across three subdistricts in different parts of Indonesia were randomly assigned to an intervention or comparison group.
| Group | Selection process for local infrastructure projects |
|---|---|
| Intervention | Villagers selected from among the proposed projects by voting at a local election. All adult villagers could vote for the general project, and all adult women could vote for the women’s project. |
| Comparison | Project proposals were selected at a local village meeting, consisting of representatives from each hamlet of the village. |
Researchers collected data on the types (e.g., road, bridge, clean water, etc.) and locations of the general and women’s projects selected by treatment and comparison villages. They also collected data on the relative size of the hamlet where the project would be located, the distance of the hamlet from the village center, and the relative affluence of the hamlet (poorest in the village, richest in the village, or in between, as ranked by the village head). To evaluate the impact of the elections on voter perceptions, researchers conducted a survey before and after the selection process. A separate survey of village and hamlet heads measured local elite preferences.
Results and policy lessons
Turnout for the direct elections was high: Nearly 80 percent of villagers voted, which means that about 20 times as many villagers participated in the elections as attended village assembly meetings in comparison villages.
Elections had little impact on the types of projects chosen: For the general projects, there was almost no difference between representative meetings and elections on the types of infrastructure projects chosen. For the women’s projects, the elections led to more road and bridge proposals, more water and sanitation proposals, and fewer irrigation proposals, but the differences were not statistically significant, perhaps due to the small sample size.
Elections resulted in more women’s projects located in poorer areas, but brought the women’s projects into closer alignment with elite preferences: Elections led to a 14 percentage-point increase in the probability that the women’s project would be located in the poorest hamlet in the village. At the same time, elections increased the likelihood that women’s projects resembled the types of projects preferred by elites.
One explanation for these seemingly conflicting results is that the elections intervention did not affect the proposal generating stage of the KDP process. If women in poor hamlets had little power to affect which projects were proposed by the hamlets, it would make sense that those projects reflected elite preferences. Nonetheless, women in the poorest hamlets apparently were not deterred from voting for the projects in their own hamlets, as these were more likely to win at the election stage.
Elections increased satisfaction with the projects and the selection process: People in the elections group were significantly more likely to say that the project was chosen in accordance with their wishes, that it would benefit them personally, and that they would use the project. They were also more likely to say that the proposal was fair, that it was chosen in accordance with the people’s aspirations, and that they were satisfied with the KDP program.
To help determine whether these differences truly reflected people’s attitudes on the KDP projects—and not a shift in views on government more generally—researchers also asked the respondents to rate the performance of the president of Indonesia and the head of the local village. Having the direct elections did not influence these approval ratings, suggesting that changes in people’s feelings about government in general were not driving these results.
People in villages with elections were more likely to know about the projects and to express willingness to contribute to them. Survey respondents in the treatment villages were 40 percent more likely to correctly identify the type and location of the general project in their villages, and 49 percent more likely to know those facts about the women’s project. People in villages that had elections were also 17 percentage points more likely to state that they would voluntarily contribute something—especially labor—to the project.
Higher satisfaction was not caused by transfers from elites wanting to influence people’s votes: A possible alternative explanation for voter satisfaction was that local elites “bought” votes, either through festivals or parties tied to the elections (a common practice in Indonesia) or direct transfers. However, there were virtually no campaign-style festivals or transfers to villagers reported in the survey.
Direct participation can substantially improve satisfaction with the political process, even if the final outcomes do not change much: More people expressed positive views of the projects and the selection process in villages that had elections. More people stated that they were willing to contribute voluntarily to the projects and more people could correctly identify details of the projects in election villages. These differences were all statistically significant despite the similarity of the mix of projects chosen in election and comparison villages, and there was no evidence that they were driven by transfers from elites wanting to influence the vote.
Voting is only part of participation in the policy process. The elections treatment affected only one stage in a three-stage process. The proposal generating stage and the final funding stage may still have been elite-controlled, even though the village selection stage was subject to a vote. Fully enfranchising women and the poor may require increasing their participation at other stages in the policy process as well.
Women’s participation, women’s preferences: When asked about their preferred project type, women more frequently identified drinking water projects (23 percent of women, 3 percent of men), and men preferred roads and bridges (38 percent of women, 64 percent of men). These ratios closely match the actual project selections for women’s and general projects, suggesting that the women’s projects reflect the preferences of women in the village and the general projects reflect the preferences of men. The elections led women—but not men—to more favorably view the women’s projects. This suggests that the increase in satisfaction was tied to increases in participation since only the women were involved in choosing those projects. An evaluation of India’s quota policy for female village leaders found similar results: men and women have different preferences for local public goods and having female leaders led to more projects that matched women’s preferences. For example, village councils randomly selected to be led by a woman were significantly more likely to invest in drinking water facilities, which was the issue most frequently expressed as a priority by women.1
Chattopadhyay, Raghabendra, and Esther Duflo. “Women as Policy Makers: Evidence from a Randomized Policy Experiment in India.” Econometrica 72, no. 5 (2004): 1409–43. https://doi.org/10.1111/j.1468-0262.2004.00539.x.
In India, a biometrically authenticated payment system reduced corruption and substantially improved the delivery of government social assistance programs despite partial implementation.
Policy issue
Developing countries spend significant resources on social assistance programs, but program delivery is often constrained by corruption and inefficiency. This can put a strain on state finances and reduce these programs’ potential to improve the lives of the poor. In 2016, the Government of India allocated US$70 billion1 to social assistance programs. Yet much of this money may not have reached its intended recipients; leakages, or funds diverted, from past programs have been estimated to be as high as 51 percent.2
One way to improve program delivery could be an electronic payments system with biometric authentication that deposits government transfers directly into people’s bank accounts. By verifying recipients’ identities using fingerprint readers at the time of withdrawal, the system could help ensure that intended recipients are actual recipients. However, these systems can be complex and difficult to implement, and little rigorous evidence exists about their impact on payment delivery. For example, beneficiaries might be denied payments if they are unable to enroll, or corrupt officials may undermine the new system. Given the technical and political challenges, the cost-effectiveness of a biometric payments system is unclear.
Context of the evaluation
In 2006, the Government of Andhra Pradesh3 launched the Smartcard system, India’s first large-scale biometric payment system, to improve the delivery of two major social welfare programs: NREGS, which guarantees rural households 100 days of paid employment annually, and SSP, which makes monthly payments to elderly, widowed, and disabled individuals below the poverty line.
Smartcard system reforms
| 1. Technology Change: Beneficiaries provided biometric data (ten fingerprints and a digital photograph) to create uniquely identified Smartcards linked to newly created bank accounts. Beneficiaries could use these cards to obtain money directly from customer service providers located in each village. |
| 2. Organization Change: The Government of Andhra Pradesh contracted banks to manage payments in each district. Payments were distributed to beneficiaries in villages through local customer service providers |
Implementation challenges related to payment logistics stalled the Smartcards’ initial launch in several districts. In 2010, leveraging previous successful collaborations,[!4] researchers worked with GoAP to relaunch the program in eight districts and test its effectiveness through a large-scale randomized evaluation reaching nineteen million people.
Details of the intervention
Over two years, the Smartcard system was introduced across 296 randomly assigned sub-districts. After the two years, researchers compared payments and funds disbursed in sub-districts chosen to implement the system earlier (the treatment group) with those in sub-districts where the system was not introduced until after the evaluation (the comparison group). They measured impacts on payment logistics, leakages, and program access.
The status quo SSP payments system was relatively straightforward; a fixed list of beneficiaries collected cash payments from local officials in their villages. But NREGS, with participants and payment amounts that change regularly, was more vulnerable to leakages. Workers often gave paper identity documents to local officials to collect money on their behalf from branch post offices with no formal authentication procedure. Long payment delays were common, and widespread reports suggested that officials often pocketed payments for themselves by over-reporting work performed or under-paying workers.5
To address these leakages, the Smartcard system introduced: (1) a technological reform in which beneficiaries who chose to enroll received biometrically authenticated identification cards, called Smartcards, linked to bank accounts, and (2) an organizational reform in which payment logistics were contracted to private banks and customer service providers (CSP) in each village. Banks were rewarded a 2 percent commission on all payments delivered.
Results and policy lessons
The Smartcard system was only partially implemented.
After two years, only 67 percent of villages in the treatment group were using Smartcards for NREGS (79 percent for SSP) and only half of all payments were made using the new system. These results reflect significant implementation challenges particularly related to enrolling beneficiaries, who often missed initial enrollment drives for the new system.
Despite partial implementation, the new system substantially improved the payment process by reducing delays and the unpredictability of payments.
Under the new payment system, NREGS workers spent 22 fewer minutes collecting payments (a 20 percent decrease relative to the comparison group collection time of 112 minutes) and received their payments 6–10 days sooner. Payments also become more predictable as the variation in the length of delays fell. These changes affected both workers with and without Smartcards, suggesting that improvements were driven by the organizational reform rather than the Smartcard technology.
Smartcards also reduced leakages, increasing the payments that beneficiaries received.
NREGS participants with Smartcards reported 24 percent higher weekly earnings of INR 35 (US$0.72 at the time of evaluation), while SSP beneficiaries reported a 5 percent increase of INR 12 (US$0.25). Importantly, official government disbursements did not change for either program, implying a 41 percent decrease in NREGS leakages and a 47 percent decrease in SSP leakages. There was no evidence of reduced leakages for beneficiaries without Smartcards, suggesting that the biometric authentication was the main driver in decreasing leakages.
Beneficiaries overwhelmingly preferred the new system.
In follow-up surveys, 90 percent of NREGS participants and 93 percent of SSP beneficiaries in treatment areas indicated that they preferred Smartcards to the old system, largely because payment collection was easier, faster, and less susceptible to manipulation.
Smartcards did not reduce program access.
The Smartcards system had no impact on access to the SSP program and increased access to NREGS; 7 percent more households reported participation in NREGS compared to 42 percent in the comparison group (a 17 percent increase). Researchers found no evidence that the Smartcards negatively affected vulnerable households such as the extremely poor.
Overall, Smartcards were cost-effective and generated large savings in the short term.
Implementing Smartcards in the eight districts cost an estimated US$4 million for NREGS and US$2.3 million for SSP annually. But this was offset by an estimated US$38.5 million annual decrease in leakages for NREGS, and a US$3.2 million annual decrease for SSP. Researchers estimated that the gains from beneficiaries’ time-savings in the NREGS payment collection process alone, at US$4.5 million, exceeded the cost of the new system.
Biometric payment systems can improve program delivery without excluding vulnerable households.
Even partially implemented, the Smartcard system significantly improved program delivery and reduced corruption. Importantly, these improvements occurred without hurting or excluding any beneficiaries. Researchers believe this was, in part, because GoAP did not make the biometrically authenticated card mandatory for collecting payments, so that beneficiaries who did not (or could not) enroll could still receive payments.
Policymakers should consider strategies, such as gradual implementation or incentives for implementers, to align key stakeholders’ interests and mitigate the challenges of payment system reforms.
Despite senior leadership support and substantial administrative resources behind the program, GoAP found implementing the Smartcard system difficult. Gradually rolling out reforms can allow local officials to better understand and manage implementation details. By providing commissions on successfully delivered payments, GoAP also incentivized banks and CSPs to correctly implement the system. These strategies aided the transition to the Smartcards, aligning stakeholders’ incentives and allowing time for adjustment.
Investments to improve poor state capacity for program delivery can generate significant benefits even in the short term.
While investing in state capacity can be costly, the Smartcard system generated more than US$40 million in savings from reduced leakages, demonstrating that there can be significant short-term returns to improved program delivery. Importantly, a secure payment infrastructure is a public good that improves not just government programs but could also facilitate transactions for the private sector and individual citizens.
Rigorously evaluating the rollout of a large-scale program can be a powerful way to monitor its impact and ensure that widereaching policies are informed by evidence.
In 2013, after receiving overwhelmingly negative feedback from local officials, GoAP nearly stopped the reforms—until officials reviewed this evaluation’s results on program improvements and beneficiaries’ high satisfaction rates. Since then, the evaluation has informed a national policy on biometrically authenticated identification cards, demonstrating the policy value of rigorous, large-scale evaluations.
| Scaling up based on the evidence |
| This evaluation has since informed the Government of India’s Aadhaar initiative, a national policy providing every Indian resident with a biometrically linked identification card. The Ministry of Finance cited the study in its 2014–15 and 2015–16 Economic Surveys—annual reviews of the Indian economy—to advocate for the use of biometric authentication in program delivery across all anti-poverty schemes. In 2016, the Government of India passed the Aadhaar Act, which provides legal backing for the use of these identification cards in the delivery of national benefits, subsidies, and services. |
Government of India. 2017. “Expenditure on Subsidies for the Poor and Social Assistance Programs.” in Expenditure Budget Vol. I, 2016–17. New Delhi: Government of India, Ministry of Finance.
For example, for leakages in NREGS see: Imbert, Clement, and John Papp. 2016. “Estimating Leakages in India’s Employment Guarantee: An Update.” For leakages in the Public Distribution System (India’s subsidized food program) see: Government of India. 2005. “Performance Evaluation of Targeted Public Distribution System.” New Delhi: Programme Evaluation Organisation, Planning Commission.
In 2014, Andhra Pradesh was separated into two states—Telangana and Andhra Pradesh. This summary refers to the formerly unified Andhra Pradesh.
Previous work by J-PAL affiliates in Andhra Pradesh includes evaluations on school choice and performance pay for teachers.
Dutta, Puja, Rinku Murgai, Martin Ravallion, and Dominique P. van de Walle. “Does India’s Employment Guarantee Scheme Guarantee Employment?” World Bank Policy Research Working Paper # 6003, March 2012. Niehaus, Paul, and Sandip Sukhtankar. 2013. “Corruption Dynamics: The Golden Goose Effect.” American Economic Journal: Economic Policy 5(4): 230-269. Pai, Sandeep. 2013. “Delayed NREGA payments drive workers to suicide.” Hindustan Times, December 29, 2013. Accessed March 1, 2016.