


Survey design
Summary
This section covers the essentials of survey design. It includes an overview of survey development, practical tips, formatting suggestions, and guides to translation and quality control.
The process of survey design
There are five key steps in the process of designing effective questionnaires:
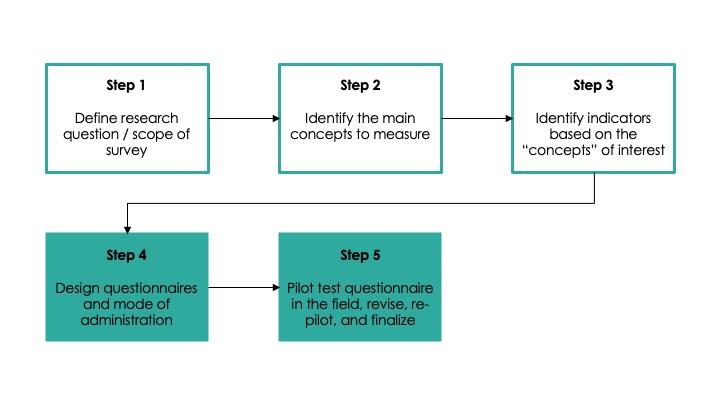
This page focuses on Step 4, questionnaire design. As the diagram above suggests, it is important to be clear on your research questions, theory of change, and concepts to measure before starting to design the questionnaire. See the Introduction to measurement guide for resources on Steps 1-3 and Questionnaire piloting for resources on Step 5.
Considerations while designing a survey
- Always collect metadata on the cover page. This page includes personally identifiable information is identifying and will need to be removed later, so if using a paper survey it must go on a detachable cover page. If using a digital data collection method, it will need to be encrypted and stored separately from the module data. This data should include:
- Identity of enumerator
- Location information
- The unique identifier
- Start/end time/date
- Respondent’s identifying information
- Baseline and endline surveys differ in key ways. The aim of baseline surveys is to describe the population as it is before treatment, therefore they require a strong focus on covariates. Endline surveys are primarily used to measure outcomes and therefore require questions to elicit information on implementation and possible spillover effects. For more on this see the first section of this EGAP blog post on survey design.
- Responding to a survey is costly for the respondent in terms of time and energy, so keep your data collection short and as engaging as possible (see also Ethical conduct of randomized evaluations).
- Include exactly what you need to answer your research questions, or potential future research questions, but do not include questions if you do not have a clear idea of how they would be used. Follow the checklist for proofing each question.
- If you have a sufficiently large sample, you can shorten a questionnaire by randomly assigning some of the respondents to different forms.
- Use carefully considered data validation techniques wherever possible.
- For digital surveys it is possible to limit possible answer options (in SurveyCTO this would be called ‘Constraints’), e.g., constrain age values to 0<=age<120 (see Survey programming).
- For paper surveys, instructions can specify possible options and regular enumerator checks can ensure compliance.
- Think about whether/how you will need to match datasets.
- Use unique identifiers that are the same across datasets and survey rounds.
- If doing both individual and household surveys make sure that you have a code for both and a way of linking them across survey rounds.
- If using census or other administrative data files, think about if there are specific geographic indicators (e.g., sub-district codes) that will assist you in linking datasets.
- Remember to thank the respondent at the end of the survey! (Add a note to remind enumerators.)
- See this checklist for proofing each question, also available in the Related Downloads section.
Developing the survey
Moving from indicators to questions
As described further in Introduction to measurement and indicators, indicators are used to measure outcomes or concepts. The early stages of survey development involve gathering ideas and beginning to formulate questions through:
- Reviewing the literature and consulting experts
- Focus groups: Interviewing small groups of people (5-10 per group) to investigate the research question, evaluate individual survey questions, and understand the range of responses
- Cognitive interviews: Trying to understand the cognitive process involved in understanding, processing, and responding to a survey question, particularly for more complex questions, including those that require calculation or major acts of recall
- For more details on cognitive interviewing see Peterson (2017), Willis and Artino (2013), and the in-depth 1999 how-to guide produced by Gordon Willis for the American Statistical Association.
Using existing surveys
If you are designing a follow-up survey, be sure to use the previous round’s questionnaire as your starting point. To facilitate comparability across survey rounds, only modify questions when absolutely necessary. In general, it is better to remove or add questions than to change them.
Even when designing a new instrument, you should not start from scratch but instead start by reviewing existing, well-tested surveys that occur in the same country or sector. When compiling questions from existing surveys, be sure to add a column noting the source of each question. Good sources of survey questions include:
- J-PAL/IPA Datahub for Field Experiments in Economics and Public Policy
- World Bank microdata catalog
- The World Bank’s Enterprise Surveys database
- IFPRI microdata catalog
- International Household Survey Network survey catalog
- Demographic and Health Surveys Model Questionnaires
Types of questions
At the highest level, questions may relate to facts or to perceptions/subjective expectations, but within these categories, you may also need to gather data that is observational, sensitive, or that relates to things that people do not know well. This section details key considerations and practical advice for each of these types of questions.
Facts
When measuring facts:
- Consider using pre-existing modules that have been tested in your survey area or on your survey topic; see the section on “Using Existing Surveys” above.
- Start from how you will use the data, and work backward to the minimum level of precision required to answer the question; do not gather data that is more precise than you will realistically use.
- Consider using ranges instead of point estimates for certain questions. For example, estimating the precise number of dollars and cents spent on food each day may be time-consuming and difficult for the respondent, but they may be able to tell you a spending range (e.g., <$1, $1-5, >$5) immediately.
- Be aware of local context and culture (local collaborators are particularly helpful to involve here).
- Do not assume that lists of response options used elsewhere will be exhaustive in your context (e.g., are there additional levels of types of education? Are there additional languages or dialects?).
- Be sure to involve someone who is intimately familiar with the local context and culture in the survey design process, and select enumerators from the local region wherever possible.
- Pilot extensively in areas that are as similar as possible to your survey areas.
Subjective questions
Subjective questions assess subjective psychological states and are not verifiable by external observation or records. They aim to measure a number of different things:
- Beliefs about the object (“Is your child’s school providing them with an adequate education?”)
- Expectations, i.e., plans for future actions (“Do you plan to enroll your child in the same school next year?” )
- Attitudes about the object (“Your neighbor is trying to decide if they should send their child to secondary school or have them work instead. If the child attends secondary school they potentially could work in a higher paying job in the future, but they wouldn’t be earning money for the family in the present. Ultimately, your neighbor decides to send their child to school. Do you agree with their decision?”)
Practical advice for subjective questions:
- When thinking about probabilities and subjective expectation use Likert (responses range from “very likely” to “very unlikely”) or cardinal scales (which request a precise percentage) for eliciting point estimates.
- Responses will often clump around round numbers such as multiples of ten due to rounding/uncertainty; point estimates may, therefore, be approximate, which means that Likert scales may save time and effort without losing precision. Another option is to use a series of questions rather than just a single point estimate to get a more precise estimate; see Bruine de Bruin (2011) for more information.
- Visuals—such as ladders or expression faces—may help respondents to understand the question and also vary the format of the interview.
- For more on measuring probability perceptions see recent World Bank posts on measuring subjective expectations.
- It may sometimes be difficult to interpret an absolute level of, for example, subjective welfare, or to decide how to sum welfare across a number of different indices into an overall metric of welfare. Using questions about trade-offs across different aspects of welfare can be a good way to elicit what respondents actually value. For more on this see the recent World Bank post on measuring subjective welfare.
- Subjective questions can be costly in terms of both time and cognitive load; as a rough guide it may take ~2-5 minutes of survey time to get a subjective point estimate (Delavande, Gine and McKenzie 2009).
- Using vignettes can be a useful tool to improve the inter-comparability of different samples across time or contexts. For more information see the recent World Bank post on using vignettes to anchor subjective responses.
- Subjective questions cannot be used as a substitute for impact evaluations; respondents may struggle to construct accurate counterfactuals when answering subjective questions (see, for example, McKenzie (2016)).
Sensitive questions
What makes a question sensitive depends on culture and context, but information relating to identity, illegal activities, and socially unacceptable behavior are almost always sensitive. Respondents may not answer truthfully due to social desirability bias or embarrassment, or because they feel that a different answer is strategic. The following strategies can be used to deal with sensitive questions:
- Have a data security plan and assure respondents that information will be kept private. Also think about the best setting for your survey; it should be somewhere private and comfortable, where peers will not be able to hear or influence responses.
- Collect data through online surveys or self-administered modules, which may limit the level of embarrassment that respondents feel in giving an accurate answer. A recent innovation in self-administered modules is Audio Computer Assisted Self-Interviewing (ACASI): see Mind and Body Research Group’s guide for practical implementation tips, and Cullen (2020) for a randomized comparison of ACASI against standard direct face-to-face survey methods and list randomization.
- Use “deliberate loading,” i.e., set the question in a context that the behavior is acceptable. For example: “Disciplining children can be hard and parents do it in several ways. Have you ever hit your child to discipline them?” (Sudman and Bradburn 1982).
- Avoid placing sensitive questions too early or too late in the survey. If they are asked too early there has not been much time to build rapport and respondents may cut the interview short, but if they are asked too late they may leave the respondent feeling uncomfortable.
- Use enumerators that are not personally known to the respondent, and consider choosing a respondent whose demographic characteristics (e.g., sex, age) may reassure the respondent.
- Use indirect or non-survey techniques to gather the information. These could include:
- List randomization (for example, Karlan & Zinman 2012): A group is divided into two subgroups and asked how many statements from a list are true. One subgroup is asked non-sensitive questions, while the other is asked the same non-sensitive questions plus a sensitive one. A comparison of the proportion of yes/no in the two groups will tell you the proportion the group that answered yes to the sensitive question.
- Random response method (for example, Blair, Imai, and Zhou 2015, and Chuang et al. 2020): The respondent flips a coin and answers ‘yes’ if they get heads or gives their actual response if they get tails. Researchers know 50 percentage points of the proportion of respondents who said yes come from the random flipping of the coin; the remaining ‘yes’ responses are an approximation of the true proportion that would say yes.
- Other techniques include polling booths, revealed preference approaches; mystery clients (see also this summary); incognito enumerators, bio-markers such as BMI or HIV tests; mechanical tracking devices; satellite imagery; implicit association tests; lab experiments and games; and random spot checks.
- This 2013 World Bank blog post details three papers that use some of these techniques (in this case list randomization, endorsement experiments, and reticence adjustments) to get at sensitive information.
See the World Bank DIME wiki for more information on sensitive questions (J-PAL staff and affiliates: see also this lecture from J-PAL South Asia's Measurement & Survey Design course).
Questions about things people don’t know well
Respondents may have difficulty answering questions on anything they have to estimate, particularly when they are estimating across time. They may be prone to error due to forgetfulness, computational errors or weak numeracy skills. There are strategies you can use to minimize errors:
- Avoid questions that require long recall can result in biased or imprecise data. For example, instead of asking respondents about their income over the previous year, rely on administrative data or financial records whenever possible. Alternatively, consider using frequent follow-ups, diary or direct observation. See Wiseman, Conteh, and Matovu (2005) for a guide to designing diaries.
- Ask these questions in a manner respondents are familiar with. For example, many respondents might give a more accurate estimate of how much time it takes to walk somewhere than how far the distance is in absolute terms.
- Build consistency checks into the instrument, e.g., error messages for logically impossible answers. For example, if respondents are asked about their satisfaction with a product or service and their intention to repurchase, the consistency checks can verify that their intention aligns with their reported satisfaction level. See more under Survey programming.
- Triangulate by taking multiple measures of the same indicator. For example, when assessing participants' physical activity, inquire about both the duration of exercise sessions and the number of steps taken per day. If a participant claims to exercise for an extended period but reports a low step count, verify the information in real-time with the respondent.
See also the World Bank DIME Resources lecture on Survey Instruments.
Observational questions
Observational questions, in which the enumerator infers something about the subject from observing them rather than direct questioning, mitigate against respondent bias and can be effective in monitoring the program (see the Implementation monitoring resource), verifying the existence of household assets or items of facility infrastructure, and more.
One possible disadvantage, particularly when assessing behavior, is the possible existence of Hawthorne effects. That is, subjects may alter their behavior due to their awareness of the interviewer.
Tips for observational questions:
- Develop detailed protocols and standardized checklists to ensure consistency of information.
- Ensure data collection of behavioral measures is done under the same circumstances for all individuals.
- To mitigate Hawthorne effects (though in a randomized evaluation these are likely to be the same across treatment and control):
- Observe over a long period of time, as evidence suggests that subjects return fairly quickly to their original behavior (Das et al. 2008). For more information—and for lots of practical tips for observational work—see Laura Brown’s blog post on observational field research for the University of Washington.
- Explain the reasons for the observation to prevent respondents from feeling threatened.
- Triangulate observational data with other sources.
Formulating effective questions
Each question should be SMART:
- Specific: Asks one precise question
- Measurable: Quantifies accurate and unbiased information
- Accessible (understandable): Easy to comprehend and clearly defined
- Relevant: Measures a key or intermediate outcome for your project
- Time-bound: Has a clear specification of the relevant time period
There are a number of different ways of formulating questions:
- Open-ended questions: Have no pre-coded answers so that respondents can answer however they like. This is an advantage when we lack knowledge of likely answers and must be used when it is not possible to collect data in pre-coded formats. However, open-ended questions will require coding—which may be difficult and time-consuming—before data analysis is possible.
- Closed-ended questions: Have pre-coded answers, and respondents must choose between the available options. This provides precise, easy-to-analyze information but restricts options/choices, which may make the data less rich. To ensure that lists are exhaustive it is best practice to include “other (specify)” in all lists so that the interviewer can record the responses that are not mentioned in the codes.
- Field coding: Somewhere between open-ended and close-ended questions, field coding is when respondents answer in an open format verbatim, and then the interviewer codes the answers into predetermined response categories. This technique can be useful if there is a reason to hide the response options and may be used to quantify findings of qualitative surveys such as focus group discussions (FGDs). It does require, however, that the enumerator is skilled in assigning narrative responses to codes.
Formulating effective responses
Designing good response codes requires background and qualitative research. Ensure that responses are:
- Clear and simple
- Mutually exclusive
- Completely exhaustive (include “other (specify)” wherever you are in doubt)
- Allocated code numbers consistently across questions
Response scales can be used to gather information, though all may be subject to the central tendency bias (i.e., a tendency to choose the middle option). Types of response scales include:
- Likert scales (strongly agree, agree, neither agree or disagree, etc.)
- Ranked responses:
- Ask respondents to rank a set of options through numbering. These help us understand levels of importance and help respondents to differentiate/prioritize, but they also assume that respondents feel different about different options and that they know enough about each item to make a comparative judgment.
- Ranking takes time and mental effort; in general, you should limit your list to fewer than 7 options.
- You can also use numeracy scales and frequency scales.
Practical tips for survey design
Modules and structuring the questionnaire
In broad terms, questionnaires are generally structured as follows:
- Consent: It is vital that you get informed consent whenever you collect data about individuals through surveys, photos, videos or audio recordings. The informed consent form should include all relevant information about the study (personnel and contact info, study purpose, organization, efforts you will take to ensure privacy/anonymity, etc.). See Define intake and consent process, Ethical conduct of randomized evaluations, and IRB proposals for more information.
- Modules are components or sub-sections of an instruction (e.g., consent form, demographic questions, health, etc.)
- For each module you should start by drafting a bullet list of key indicators, before agreeing within your team on relevance and looping (e.g., does it apply to all respondents? Does it need to be answered by all household members? Should there be a maximum number of loops?).
- Questions on the same topic should be grouped together into modules, as this provides natural pauses in the questionnaire and makes it easier for the enumerator and the interviewee to follow the flow of the questions.
- It is good practice for questions at the start of the questionnaire to explicitly address the topic of the survey as described to the respondent in the consent form.
- For each module, provide an introductory script to guide the flow of the interview. The World Bank DIME wiki guidelines on questionnaire design give the following example: “Now I would like to ask you some questions about your relationships. It’s not that I want to invade your privacy. We are trying to learn how to make young people’s lives safer and happier. Please be open because for our work to be useful to anyone, we need to understand the reality of young people’s lives. Remember that all your answers will be kept strictly confidential.”
- Provide instructions to enumerators: Should they read out options? Should they probe if the respondent does not respond? Add any special instructions for certain sections, such as who the respondent should be for each module (e.g., person in charge of household finances for a module on expenditures).
Structuring questions within modules
Wherever possible, questions should flow as follows:
- From general to specific
- From less sensitive to more sensitive. Early questions should be easy and pleasant to answer and should build rapport between the respondent and the researcher
- From factual to attitudinal in order to build up rapport on objective questions before moving to questions that reveal something about the respondent’s beliefs or opinions
Ensure that you use skip patterns, particularly when surveys are long. Skip patterns direct the flow of questions so that respondents answer only those questions that are relevant to them.
Mistakes with skip patterns can lead to two possible types of errors:
- Errors of commission: Individuals get questions that are not relevant to them, and therefore enter incorrect/misleading information.
- Errors of omission: Individuals do not get the chance to answer questions that were relevant to them.
Skip patterns can easily be coded into your surveys using software such as SurveyCTO.
Supporting documents
You may also want to consider including the following as part of your survey materials:
- Enumerator manual containing detailed information and protocols to be followed while surveying. This should contain question-by-question instructions, “dos and don’ts” and general protocols/codes of conduct. For guidance on enumerator manuals and training see the Surveyor hiring and training resource.
- A summary (“cheat sheet”) of key instructions can also be useful in the field.
- Additional materials such as answer cards or visuals can be a good way to aid understanding and make the survey more engaging. Examples include pictures to illustrate Likert scales, or pictures of local units of different vegetables or cereals (e.g., a 5-liter bucket, small/large plates, small/large bundles, etc.).
- Respondent tracking materials, as detailed further here:
- A list of respondents with sufficient information for proper identification, e.g., name, village name, school name, father’s name, mother’s name, address, etc. This information can be collected before the survey begins and can be pre-filled into tablets/printed on the questionnaire for verification before the survey begins.
- Tracking sheets to record the status of the survey along with the unique ID of the respondent. This helps keep track of completed surveys and complete and maintain a record of reasons for incomplete surveys.
Formatting
General tips for survey formatting
- Distinguish between an instruction and what should be read out in a consistent manner.
- It is common practice to put “READ” in front of the question and present instructions in italics.
- For consistency and ease of interpretation, it is vital that digital surveys are locked and cannot be altered or updated by the interviewer. Any changes need to be done centrally and rolled out to everyone. Programs such as SurveyCTO are a good way to do this; see more in Survey programming.
- Ensure that the font size is large enough for enumerators to read the survey clearly, and that keyboards facilitate quick, easy, and accurate data entry.
- Use standardized codes, such as 1=yes, 0 or 2=no; 1=male, 2=female; as well as standardized non-response codes (e.g., using Stata’s extended missing values such as .d=don’t know, .r=refusal, .n=N/A); see more in Data cleaning and management.
Paper surveys
Most surveys are now digital.1 If you need to use paper surveys, you should bear in mind the following best practices:
- The position of text and answers should be consistent throughout the survey and arranged so that the survey is easy to read.
- There are 3 main options for recording answer choices in paper surveys:
- Blank space to write the code
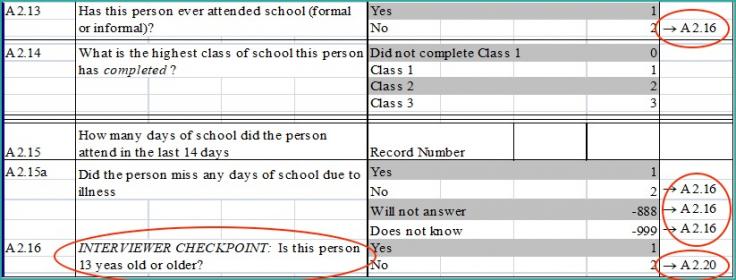
- Enumerator circles the option number to highlight the option selected (recommended as it can reduce field errors)
- Blank space next to each code and enumerator ticks the right one (though this can lead to errors, as random pen scratches may be misinterpreted as ticks)
- If a page has been intentionally left blank for formatting reasons it should state, “This page has been intentionally left blank” so that others looking at the survey know that it has not been misprinted with a blank page.
- Include a field at the top of every page for the unique identification number of the survey in case pages of the survey become detached.
- For similar reasons, number each page.
- Include an “enumerator’s comments” field at the bottom of every page where enumerators can record any other details/notes.
- Horizontal tables that fall over two pages within a survey should be printed so that the first page is on the left page and the second page on the right. When the booklet is open, the enumerator can then read the entire table together across the two pages.
- For numeric responses, boxes can be used to indicate how many digits the response should be. For example, if you know the response must be a three-digit number, use |__|__|__| to force the enumerator to write three digits.
- When formatting skip patterns in Word documents:
- Use consistent notation: generally, a “->” is used, followed by the questions that respondents should answer next.
- Ensure that the skip pattern direction is on the same line as the answer response that is associated with the skip.
- It can be useful to dictate who should use which type of writing instrument to complete the survey. For example, enumerators use blue ballpoint pens, while scrutinizers use green pens and supervisors use red pens.
Phone Surveys
In some scenarios, face-to-face interviews may be infeasible. While the principles behind phone survey design remain the same as for in-person interviews, here are a few additional crowd-sourced considerations in a blog post compiled by Kopper and Sautmann (2020) to make when adapting an existing instrument to phone surveying:
- Keep phone surveys short (30 minutes at most). Figure out your primary outcomes and be sure those are included. You may need to aggregate questions, including some outcomes. If your survey is especially long, consider breaking it up into multiple phone calls.
- To the extent possible, eliminate questions that are sensitive (for example questions about stress, mental health, sex, domestic violence, etc.), as these are harder to administer over the phone. Simplify or eliminate questions that require a lot of probing.
- If you do need to ask sensitive questions and the respondent is surrounded by other people, ask if they can be called back later when they are alone.
- Create drop down menus for question responses where possible; even if they are long, doing so can reduce entry errors and minimize the time enumerators spend typing.
For more practical guidance on phone survey design, see J-PAL South Asia’s checklist for transitioning a survey to CATI and the phone survey protocols from the UBI Kenya project. For a larger overview of phone survey considerations and collection of resources, see J-PAL’s Best practices for conducting phone surveys blog post.
Translation
Translating the survey into the mother language of your respondents speeds up the survey process and minimizes the risk of in-field translation errors. Best practices for translating are:
- First, have a fluent speaker translate the survey.
- This translation should be proofread by a second, independent fluent translator.
- Finally, have an independent translator to back-translate the text. This is ideally done by someone who is unfamiliar with the survey and intent of the questions (though if such a person is not available, field staff who did not participate in the original translation can do the back-translation). If there are differences, then a further translator should be asked to adjudicate.
- Determine how to reconcile differences.
If translating a survey, it is particularly important to:
- Translate informed consent statements.
- Use simple, everyday language rather than formal language—this is particularly important in countries where there is wide variation between everyday and formal language.
- Know (by asking a fluent speaker) when to use technical terms in the local language versus English (or French, or another language). It may be that the term is rarely used in the local language, so respondents are more familiar with the word in English/French/etc.
- Mistakes are often caught during enumerator training, as a large number of people are carefully reading through the survey. A supervisor should be carefully following the discussions and be in charge of checking the translation while the training is conducted.
- It is also useful to use paper surveys for enumerator training, as this makes it easier to compare different versions side-by-side and to write notes on translation in the margins.
Do not underestimate the time needed to get a good translation, and be sure to have a professional translator—fluency in both languages is not a sufficient condition of a good translation. If translation is done by field staff, rather than a professional translator, it is useful for several staff to work on the translation together to reach a consensus on the most appropriate and likely to be understood translation for particular words and concepts. For technical surveys, it is useful to find someone who also has some subject knowledge.
You should also have the survey available in English. Most survey software programs allow for multiple languages, with users selecting the appropriate language at the start of each survey. See also the DIME Wiki’s page on translation.
Quality control
Pressure-testing the draft survey
Once you have a draft of the survey, in both English and any local languages, you should:
- Ensure that you have team members with a strong understanding of local context and languages who can sense check the draft.
- Ask data collectors—and other people familiar with the local context—for their instincts on whether the data you are collecting would be suitable for the purposes for which you intend it.
- Ensure that any translation is checked by several people, and use a further, independent source to back-translate your translation.
- Pilot the questionnaire extensively to identify any issues or areas for improvement.
Ensuring high-quality control during primary data collection is an ongoing task that requires continuous effort. For further information on this, refer to the different types of data quality checks.
Document and communicate
It is vital to document changes to surveys, or the way questions should be interpreted, and to communicate this to relevant parties. Be sure to choose a survey system that is easy to update (SurveyCTO, for example, has good version control), and provide full instructions for using and interpreting the instrument. See more in Survey programming.
Last updated September 2023.
These resources are a collaborative effort. If you notice a bug or have a suggestion for additional content, please fill out this form.
We thank Serene Ho, Mike Gibson, and Jack Cavanagh for helpful comments. All errors are our own.
For more on the advantages and disadvantages of the two forms see the World Bank post on electronic versus paper surveys.
Additional Resources
References
Bannerjee, Abhijit, Esther Duflo, and Rachel Glennerster. 2011. “Is Decentralized Iron Fortification a Feasible Option to Fight Anemia Among the Poorest?” In Exploration in the Economics of Aging, edited by David A. Wise, 317-344. Chicago: University of Chicago Press.
Beaman, Lori, Raghabendra Cattopadhyay, Esther Duflo, Rohini Pande, and Petia Topalova. “Powerful Women: Does Exposure Reduce Bias?” The Quarterly Journal of Economics 124, no. 4 (2009): 1497-1540. https://www.jstor.org/stable/40506265
Blair, Graeme, Kosuke Imai, and Yang-Yang Zhou. 2015. “Design and Analysis of the Randomized Response Technique.” Journal of the American Statistical Association 110, no. 511.
Blattman, Christopher, Eric P. Green, Julian C. Jamison, M. Christian Lehmann, and Jeannie Annan. 2015. “The Returns to Microenterprise Support among the Ultra-Poor: A Field-Experiment in Post-War Uganda.” NBER Working Paper 21310.
Brown, Laura. “Observational Field Research.” http://faculty.washington.edu/wpratt/MEBI598/Methods/Collecting%20Data%20Through%20Observation.htm
Bruine de Bruin, Wändi, Andrew M. Parker, and Jürgen Maurer. “Assessing small non-zero perceptions of chance: The case of H1N1 (swine) flu risks.” J Risk Uncertain 42, (2011): 145–159, https://doi.org/10.1007/s11166-011-9113-5
Burgess, Robin, Matthew Hansen, Benjamin A. Olken, Peter Potapov, and Stefanie Sieber. 2011. “The Political Economy of Deforestation in the Tropics.” The Quarterly Journal of Economics 127, no. 4.
Bursztyn, Leonardo, Michael Callen, Bruno Ferman, Saad Gulzar, Ali Hasanain, and Noam Yuchtman. 2014. “Identifying Ideology: Experimental Evidence on Anti-Americanism in Pakistan.” NBER Working Paper 20153.
Chuang, Erica, Pascaline Dupas, Elise Huillery, and Juliette Seban. 2021. “Sex, Lies, and Measurement: Consistency Tests for Indirect Response Survey Methods.” Journal of Development Economics 148. https://doi.org/10.1016/j.jdeveco.2020.102582
Cullen, Claire. “Method Matters : Underreporting of Intimate Partner Violence in Nigeria and Rwanda.” World Bank Policy Research Paper 9274 (2020) https://openknowledge.worldbank.org/handle/10986/33876
Das, Jishnu, Jeffrey Hammer, and Kenneth Leonard. 2008. “The Quality of Medical Advice in Low-Income Countries.” Journal of Economic Perspectives 22, no. 2: 93-114. DOI: 10.1257/jep.22.2.93
Das, Jishnu, Jeffrey Hammer, and Carolina Sánchez-Paramo. 2012 “The impact of recall periods on reported morbidity and health seeking behavior.” Journal of Development Economics 98, no. 1: 76-88. https://doi.org/10.1016/j.jdeveco.2011.07.001
Delavande, Adeline, Xavier Giné, and David McKenzie. 2009. “Measuring Subjective Expectations in Developing Countries: A Critical Review and New Evidence.” Policy Research Working Paper 4824.
Dray, Sascha, Felipe Dunsch, and Marcus Holmlund. “Electronic versus paper-based data collection: reviewing the debate”, World Bank Development Impact (blog), May 25, 2016. https://blogs.worldbank.org/impactevaluations/electronic-versus-paper-based-data-collection-reviewing-debate. Last accessed July 15, 2020
Duflo, Esther, Rema Hanna, and Stephen P. Ryan. 2012. “Incentives Work: Getting Teachers to Come to School.” American Economic Review 102, no. 4: 1241-1278. http://dx.doi.org/10.1257/aer.102.4.1241
Evans, David. “Mystery clients in development research” World Bank Development Impact (blog), April 29, 2015, https://blogs.worldbank.org/impactevaluations/mystery-clients-development-research. Last accessed July 15, 2020.
Friedman, Jed. “Are the Danes the happiest people in the world? Using vignettes to anchor subjective responses” World Bank Development Impact (blog), February 15, 2012. https://blogs.worldbank.org/impactevaluations/are-the-danes-the-happiest-people-in-the-world-using-vignettes-to-anchor-subjective-responses. Last accessed July 15, 2020.
Friedman, Jed. “New Developments with the pitfalls and the promise of subjective welfare” World Bank Development Impact (blog), March 04, 2015, https://blogs.worldbank.org/impactevaluations/new-developments-pitfalls-and-promise-subjective-welfare. Last accessed July 15, 2020.
Gonzalez-Lira, Andres and Ahmed Mushfiq Mobarak. 2019. "Slippery Fish: Enforcing Regulation under Subversive Adaptation." IZA Discussion Papers 12179.
Jensen, Robert. 2012. “Do Labor Market Opportunities Affect Young Women’s Work and Family Decisions? Experimental Evidence from India.” The Quarterly Journal of Economics 127, no. 2 (2012): 753-792. https://doi.org/10.1093/qje/qjs002
Jones, Maria, and Laura Costica. "Survey Instrument Design & Pilot" Lecture, Field Coordinator Workshop, Washington D.C., June 22, 2018.
Kapur, Vrinda. “Measuring Sensitive Questions” Lecture, J-PAL SA at IFMR: Measurement and Survey Design course. May 30, 2018.
Karlan, Dean S. and Jonathan Zinman. 2012. "List randomization for sensitive behavior: An application for measuring use of loan proceeds." Journal of Development Economics 98, no. 1: 71-75. DOI: 10.1016/j.jdeveco.2011.08.006
Kopper, Sarah and Anja Sautmann. “Best practices for conducting phone surveys.” (blog), March 20, 2020, https://www.povertyactionlab.org/blog/3-20-20/best-practices-conducting-phone-surveys
McKenzie, David. “Three new papers on measuring stuff that is difficult to measure,” World Bank Development Impact (blog), July 08, 2013. https://blogs.worldbank.org/impactevaluations/three-new-papers-measuring-stuff-difficult-measure. Last accessed July 15, 2020.
McKenzie, David. “What’s New in Measuring Subjective Expectations?” World Bank Development Impact (blog), May 16, 2016. https://blogs.worldbank.org/impactevaluations/what-s-new-measuring-subjective-expectations. Last accessed July 15, 2020.
McKenzie, David. 2016. “Can business owners form accurate counterfactuals? eliciting treatment and control beliefs about their outcomes in the alternative treatment status.” Policy Research Working Paper WPS7668.
Olken, Benjamin A. and Patrick Barron. 2007. “The Simple Economics of Extortion: Evidence from Trucking in Aceh.” NBER Working Paper 13145.
Peterson, Christina Hamme, N. Andrew Peterson and Kristen Gilmore Powell. 2017. “Cognitive Interviewing for Item Development: Validity Evidence Based on Content and Response Processes.” Measurement and Evaluation in Counseling and Development 50, no. 4: 217-223, DOI: 10.1080/07481756.2017.1339564.
Sudman, Seymour and Norman M. Bradburn. 1982. Asking Questions. California: The University of California.
Willis, Gordon B., Anthony R. Artino, Jr. 2013. “What do our Respondents Think We’re Asking? Using Cognitive Interviewing to Improve Medical Education Surveys.” J Grad Med Educ 5, no. 3: 353-356. doi: 10.4300/JGME-D-13-00154.1
Willis, Gordon B. 1999. “Cognitive Interviewing: A 'How To' Guide”. Short course presented at the 1999 Meeting of the American Statistical Association.
Wiseman, V, L Conteh, and F Matovu. 2005. “Using diaries to collect data in resource-poor settings: questions on design and implementation.” Health Policy and Planning, 20, no. 6: 394–404, https://doi.org/10.1093/heapol/czi042