Introduction to measurement and indicators
Summary
The goal of measurement is to get reliable data with which to answer research questions and assess theories of change. Inaccurate measurement can lead to unreliable data, from which it is difficult to draw valid conclusions. This section covers key measurement concepts, means of data collection, from whom data should be collected, and common sources of measurement error. The following section, survey design, applies these concepts to designing survey questions and answers. See also our repository of measurement and survey design resources that introduce readers to the measurement tools, difficulties, and solutions in a range of topics.
Essentials
-
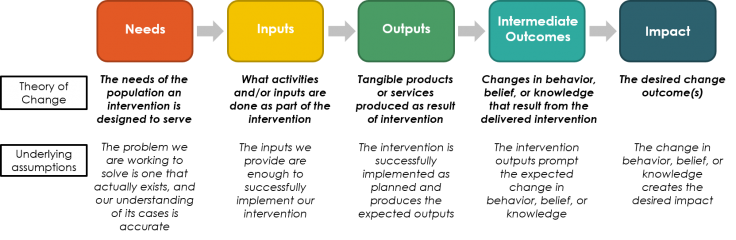
Testing your theory of change (ToC) requires data on needs, inputs, outputs, intermediary outcomes, and impact.
-
You should collect data on covariates (particularly if you believe there will be heterogeneous treatment effects), predictors of compliance, and measures of actual treatment compliance. It can be helpful to collect information on context, cost effectiveness, and qualitative information (the “why” and the “how”).
-
Secondary data (e.g., administrative data, census data) can complement or even substitute for primary data collection. If you plan to use secondary data, be sure to consider how you will integrate the two data sources when you design your survey.
-
Measurement problems arise when:
-
Constructs (the concept to be measured) are vague or poorly defined
-
Indicators are imperfect measures of the underlying construct
-
Individual responses are skewed, e.g., through distraction, illness, poor comprehension, etc.
-
Human/device errors lead to erroneous values
-
-
There are many types of measurement error, here grouped into three broad categories:
-
Question issues: These arise due to poorly formed questions. Concerns include vagueness, negatives, double-barrel questions, presumptions, overlapping categories, and framing effects (within questions and within the questionnaire as a whole).
-
Response-related issues: These arise due to use of incomplete or overlapping categories in responses, i.e., errors around construction of answer choices.
-
Respondent issues: These arise due to the respondent’s inherent biases while answering to questions. They include recall bias, anchoring, partiality, social desirability bias, telescoping, reporting bias, and errors of differential response.
-
-
Bias that is correlated with the treatment is more serious than bias that is not.
The purpose and practice of measurement
Some first order decisions:
- What do you need to measure?
- What type of data is needed to measure this?
- How should it be collected?
- Who should you collect it from?
What do you need to measure?
You will need to gather information to test your assumptions along every step of your theory of change (ToC) from inputs to the final results. Make sure you are clear about the theoretical roadmap for your project in your particular context. Data is needed at any point where the logical chain of your ToC might break down.
It is often useful to also collect data on the following:
-
Covariates: If you believe the treatment effect may vary according to certain characteristics of participants or the study location, such as gender, urban vs. rural location, distance to nearest hospital, etc., be sure to collect data on these characteristics. It is useful to decide in advance whether to stratify on certain characteristics, which will help ensure you are powered to detect heterogeneous treatment effects. Note that this will affect other planning decisions: if stratifying, be sure to account for this in power calculations and budgeting. If writing a pre-analysis plan, the covariates for stratification should be included. See Angelucci, Karlan and Zinman (2013) for an example of a paper that measures heterogeneous treatment effects.
-
Predictors of compliance and measures of actual treatment compliance (at the individual and group level): For example, for a medical intervention involving taking tablets, we might want to gather information at baseline on whether the respondent currently takes any tablets daily—and how often they remember to do so—and then at endline on how often they took their tablets.
-
Context (for external validity/generalizability): Examples include exposure to other, similar programs, proximity of schools/hospitals if relevant, etc. This is covered at length in the lecture on Measurement Outcomes, Impacts, and Indicators from the Evaluating Social Programs course.
-
Costs: Calculating cost effectiveness requires data on the costs of the intervention itself, as well as data on the price of any substitute products, any savings realized/costs incurred by the respondents due to the intervention, and so on. For more information, see J-PAL’s cost effectiveness analysis guide.
-
Qualitative information (the “why” and the “how”): for example, if a respondent answers at endline that their child has attended school more frequently than in the past then a follow-up question could ask about the main reason for this.
Most surveys are far too long, which can lead to respondent fatigue and therefore poor data quality. You should measure exactly what you need to answer your research questions—or potential future research questions—but not go beyond that. Do not include questions if you do not have a clear idea of how they would be used or if they do not relate to a specific research question. See more information on survey design here.
What type of data is needed?
If using primary data, or data collected yourself, there are a number of further initial decisions to be made:
-
From a person versus automatically generated?
-
Data collected with people can include surveys, exams, games, vignettes, direct observation, diaries/logs, focus groups, or interviews
-
Automatically generated data is collected from a machine or process, e.g., temperature, windspeed
-
-
From existing surveys or from new survey instruments?
-
Basing new surveys on existing surveys that have successfully captured outcomes before saves time and resources (the survey has already been developed, tested, and used), and may mean your instrument is less likely to contain problems. Sources of existing surveys can be found in the resource on survey design.
-
New surveys can be tailored to your precise specifications but require time to develop and test. See more in the resource on survey design.
-
-
Cross-sectional or panel survey?
-
Most RCTs use panel data, since the aim is to follow the outcomes of individuals who have/have not received a specific treatment, but there may be an argument for using cross-sectional data if you believe there is a strong probability that participants will change behavior by virtue of participating in the study. See the implementation monitoring resource for more information.
-
Survey data can be collected using a variety of methods including in-person interviews, phone or web-based interviews, and self-administered modules. These methods are discussed further in the resources on survey design and conducting remote surveys.
While these resources focus on collecting data for quantitative analysis, other related data collection activities include:
-
Census: Usually, you will be surveying a sample of the larger target population (sampling frame). To obtain a representative sample, you will need to sample from the larger group by either using available census data or collecting your own. This is described further in the resource on randomization.
-
Qualitative work can be used to inform intervention design, understand how implementation is going, identify the context around noncompliance or attrition, and more. Qualitative data techniques include semi-structured interviews, assessments, games, observations, and focus group discussions. An application of qualitative research methods to gender-focused research is discussed in J-PAL’s Practical Guide to Measuring Girls’ and Women’s Empowerment in Impact Evaluations.
Secondary data can be administrative data (i.e., records kept by governments and other organizations, such as births, deaths, tax returns, exam results, etc. for operations) or non-administrative data (i.e., data gathered for research or non-administrative purposes). Key considerations when using secondary data include:
-
Does the data exist, and is it accessible?
-
If the data is not accessible, is there an established process for negotiating or applying for access?
-
-
What is the date range, and has the data been collected consistently across that date range?
-
Does the dataset cover the population of interest? Is there a risk of uneven or biased coverage?
-
Does the dataset cover the outcomes of interest?
-
Is the dataset reliable and unlikely to have been manipulated?
For more information on administrative data—including why and how to use it, and possible sources of bias—see the Using Administrative Data for Randomized Evaluations and Evaluating Technology-based Interventions resources. J-PAL's IDEA Handbook provides in-depth technical information on accessing, protecting, and working with administrative data. Some secondary data sources are listed at the end of this guide.
Who do you collect the data from?
The target respondent:
-
Should be the most informed person about your outcomes of interest
-
May vary across modules. For example, in specialized modules you may want to target the household head, the person responsible for cooking, the primary income earner, or women of reproductive age.
Measurement concepts
Gathering good data requires thinking carefully about what exactly you are trying to measure and the best way to get at this information. Sometimes, the questions needed to gather even seemingly simple data (e.g., household size) can be quite complex.
Definitions
-
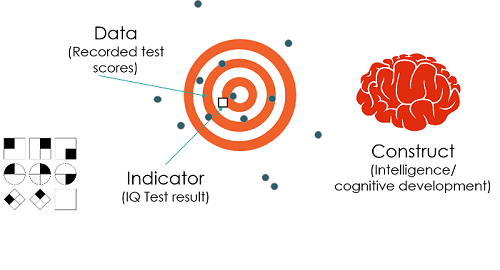
Constructs: A concept that can be measured. It may be abstract and can have multiple definitions. Examples include comprehension, crime, or income.
-
Indicators: A way to measure and monitor a given milestone, outcome, or construct and help determine if our assumptions are correct. Examples include math test scores, reported burglaries, or daily wages.
The relation between constructs, indicators and data is illustrated below:1
Measurement issues can come into play at all of these levels:
-
The construct may have multiple facets or valid definitions, making it a poor measure of the underlying concept of interest (e.g., there are many different facets of intelligence, such as emotional intelligence, logical intelligence or linguistic intelligence, and we may run into issues unless we are clear which of these is most important for the research question).
-
The indicators used to measure the construct may be imperfect.
-
Many factors determine an individual’s responses to a survey or test (e.g., level of distraction, hunger, illness).
-
Human/device error may lead to an erroneous value being recorded.
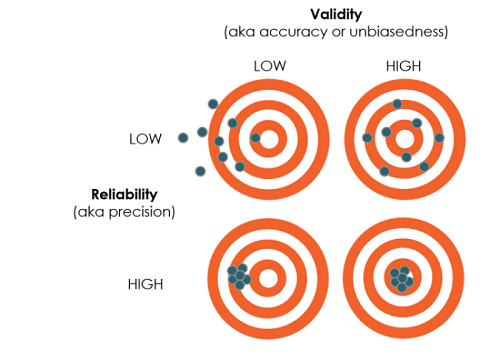
The goal of measurement is to gather data that has both high validity and high reliability.
-
Validity: Measuring the right thing
-
Key question: How well does the indicator map to the outcome, i.e., is it an unbiased, accurate measure of the outcome?
-
As an example, suppose you are using income as a measure of individuals’ sense of financial security. There are many reasons why income may not map perfectly to feelings of financial security:
-
Variation over time: a highly unstable income will most likely offer less financial security than a stable income of equal average value.
-
Expenses: financial security is arguably most closely related to savings, whereas income will only contribute to savings if it exceeds expenses.
-
-
-
Reliability: Measuring the thing precisely
-
Key question: Is the measure precise or noisy?
-
As an example, consider how measuring income per day through a recall question of earnings in the past day versus the past week will affect responses:
-
The former will be more variable than the latter because of day-to-day variation in income, and any day-level shocks that may have happened to occur the day before the survey.
-
However, measuring income over the past week introduces greater potential for recall bias, potentially leading to systematic measurement error (e.g. if respondents tend to omit certain categories of income that are hard to recall). See below for more on systematic measurement error.
-
-
Proxy indicators
Proxy indicators may be used when constructs, or the main concepts being investigated (such as crime or income), are hard to measure. Proxy indicators must be:
-
Correlated with the indicator (and the higher the correlation the better the proxy)
-
Able to change in tandem with the construct. For example, gender is a poor proxy for earnings, despite the correlation, as it will generally not be changed through an intervention.
More on common proxies, including the PPI (Poverty Probability Index), can be found in the resource on survey design.
Minimizing measurement error
Measurement error occurs when the response provided by a respondent differs from the real or true value. Errors may be random or systematic. Random error will average out to zero, while systematic error will not. It is important to distinguish measurement error, which occurs during the data collection process, from validity error, which occurs when the indicators do not appropriately map to the concept of interest. For more information on designing surveys to minimize measurement error, see the survey design resource.
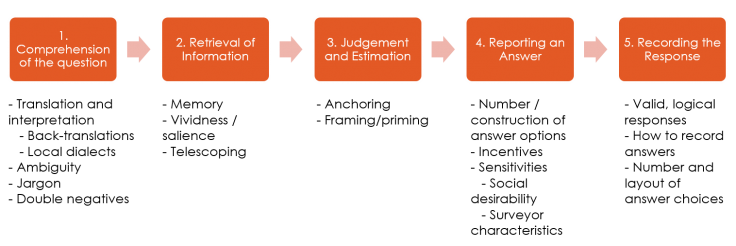
The process of answering a question
Before introducing the sources of measurement error it is helpful to consider the steps that a respondent goes through when answering a question:
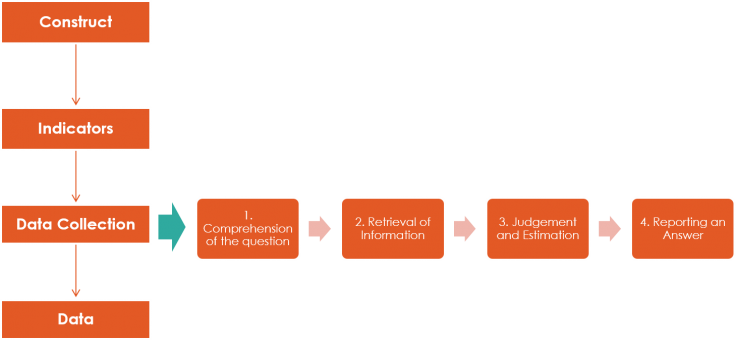
For example, a respondent asked how many times they ate rice this month must:
-
Understand and interpret the question.
-
Think about when they eat rice.
-
Add up how many days that is per week and per month.
-
Give their answer (or fit it within the answer options).
Bias can creep in during each of these steps. For example:
-
Respondents may have different interpretations of “rice,” “times,” “consume,” and “this month.” For example, does “this month” refer to the past 30 days or the month in which the respondent is being interviewed (e.g., the month of June)?
-
Respondents may interpret this as just eating grains of rice but not consider rice products such as noodles, milk, pancakes, etc.
-
Respondents may make errors in calculation, compounded by differences in interpretation in the previous step.
-
Respondents may decide to give an incorrect estimate (perhaps due to bias - people may consider rice unhealthy and therefore claim to eat less).
Types of measurement error
There are several different sources of measurement error.
These types of measurement errors can be further grouped into 1) question issues, 2) response-related issues, and 3) respondent issues.
| Issue | Example | Tip |
|---|---|---|
| Vagueness can result in respondents interpreting questions in different ways. | “How many times did you consume rice this month?” Respondents may have different interpretations of "rice," "times," "consume," and "this month." For example, does "this month" refer to the past 30 days or the month in which the respondent is being interviewed (e.g., the month of June)? |
Look at each word in your question carefully, brainstorm alternate meanings and define any ambiguous concept. This is particularly important with abstract concepts, e.g., empowerment, risk aversion, or trust. |
| Questions that involve negatives can be confusing and lead to misinterpretations | "Many people regularly do not eat at least one meal per week. For how many weeks in the last year was this not true for your family?” | Avoid using negatives wherever possible |
| Double-barrel questions: When a question has multiple parts, it may not be clear which part the question respondents are answering | "Should the government provide free education because school is too expensive in our community?" | Avoid convoluted sentence structures, and break complex questions into their constituent parts |
| Presumptions about the respondent can threaten data quality. | "How would you rate the quality of the coffee this morning?" | Try not to make assumptions (here, the question assumes the respondent drinks coffee); use filters and skip patterns wherever possible, and make sure there is a “not applicable” option for each question where relevant. |
| Framing effect (within the question): The way individuals react to choices will depend on how they are presented. | Individuals may give very different answers to the following two questions: 1. Hitting your child to discipline them is illegal in your country. Have you ever hit your child to discipline them? 2. Many people think that physically disciplining their child is an effective way to teach them how to behave. Have you ever hit your child to discipline them? |
Try to be as neutral as possible when framing questions. |
| Framing effect (within the questionnaire): The way individuals answer a question may depend on which questions they have already answered. | If a respondent has just answered a series of questions about education issues in her village she may be more likely to select education as her top policy priority. | Be careful of where questions are placed and consider randomly varying the order of questions if you are concerned about a framing effect. |
| Issue | Example | Tip |
|---|---|---|
| Completeness: Errors of completeness happen when respondents cannot find an appropriate response category. | Any question about education must include “no education." | Ensure that your response categories are fully exhaustive, and include “don’t know,” “prefer not to reply,” and “other (specify)” wherever relevant. Extensive questionnaire piloting will also help identify incompleteness in response options. |
| Overlapping categories: When categories overlap there may be multiple ways that a respondent can answer a question. | If categories run 0-5, 5-10, 10-15, etc., then respondents whose answer is 5 have two possible categories they should choose. | Ensure that all categories are mutually exclusive. |
| Issue | Example of sub-optimal approach | Example of better approach |
|---|---|---|
| Recall bias: Individuals may vary in the accuracy or completeness of their recollections. One way around this is to ask respondents to record information in real time. | “What did you eat for dinner on Tuesday 3 weeks ago?” | “I asked you to keep a food diary to record what you eat every day. Could you show me your food diary for Tuesday 3 weeks ago?” |
| Anchoring bias: Individuals tend to rely too heavily on the first (or sometimes most recent) piece of information they see and will be more likely to give an answer that is close to that information. Avoid adding anchors to questions wherever possible. | “Most people have 3 meals per day. How many meals per day do you think is normal?” | “People vary in the number of meals they consume per day. How many meals per day do you think is normal?” |
| Partiality: Respondents may be biased if a question is framed to suggest a particular answer—especially if the question or answer implies approval of one response over others. Frame all questions as neutrally as possible | Candidate X has fantastic policies around health and education. Would you consider voting for Candidate X? | Would you consider voting for Candidate X? |
| Social desirability bias: Respondents will tend to answer questions in a manner that is favorable to others, i.e., emphasize strengths, hide flaws, or avoid stigma. They may be reluctant to admit to behavior that is not generally approved of. Try to ask questions indirectly, ensure that respondents have complete privacy (and remind them of it!) and try to make sensitive questions less specific. Additional information on asking sensitive questions can be found in the measurement and survey design sections as well as our repository of measurement and survey design resources. | Hitting your child to discipline them is illegal in your country. Have you ever hit your child to discipline them? | People have different strategies for teaching discipline to their children. Have you ever hit your child to discipline them? |
| Telescoping bias: People tend to perceive recent events as being more remote (backward telescoping) and distant events as being more recent (forward telescoping), which can lead to over- or under-reporting. | What big purchases have you made in the last year? | What big purchases have you made since the 20th January last year? Please don’t include any purchases you made before that. Note that If you asked the same question at baseline it is even better to say something like: When I visited you before you said you had bought X and Y in the last year. What big purchases have you made since then? |
| Number/construction of answer choices: Individuals may choose the first in a list of options that sounds acceptable without listening to the rest—or they may choose the last one as it’s the most recent and easiest to remember. Options to get around this include limiting the length of question/number of answers and randomizing response order for lists. | Always using the same question ordering or allowing respondents to pick an answer before hearing all of the options. | Randomize the question ordering and insist that the respondents hear the whole list before choosing an option; or instruct enumerators to not read out the answer options, and train them to select those options that best reflect the respondent’s answer. |
| Reporting bias: Respondents have incentive to misreport if their answers may determine qualification for a program or whether they meet certain requirements. | If a certain level of school attendance is required to qualify for a government program then respondents may overstate the amount that their children attended school. | Stress anonymity/privacy, or use proxy measures or direct observation (e.g., the school’s attendance records) rather than self-reported answers. |
| Differential response: The intervention itself may cause the treatment (or control) group to be more likely to record certain events, more likely to respond to a question, or more likely to appear in administrative records | An intervention aims to decrease the incidence of a disease in a population through an innovative treatment, and the intervention involves a campaign to increase the number of individuals who go to the doctor. At endline, it appears that the incidence of the disease has increased, when in reality the campaign to get people to the hospital was successful, so more cases of the disease were recorded. | Be sure that the ability to measure an outcome is not correlated with the treatment assignment (e.g., any campaign to increase hospital attendance in treatment villages should also take place in control villages) and identify how the intervention may affect the response process and choose variables that are less susceptible to bias/easier to verify. |
Administrative data
Administrative data may suffer from the same sources of bias as survey data. As the researcher does not have a say in the data collection and processing phase, additional work may be needed to assess data accuracy. Common types of bias in administrative data include:
-
Reporting bias: As with primary data collection, respondents may have incentive to over- or under-report. An individual may under-report income to qualify for a social welfare program, while an administrative organization such as a school may overreport attendance to meet requirements. While the incentives to misreport may be stronger than with survey data, the problem is mitigated by the fact that much administrative data is not self-reported. To address reporting bias:
-
Identify the context in which the data were collected. Were there incentives to misreport information?
-
Choose variables that are not susceptible to bias (e.g., hospital visit rather than value of insurance claim)
-
-
Differential coverage: In addition to the issues listed above, in administrative data there may be additional differential coverage between those in the treatment vs control groups: i) differential ability to link individuals to administrative records and ii) differential probability of appearing in administrative records (e.g., victimization as measured by calls to report a crime).
-
Selection bias in administrative data occurs when administrative records only exist for individuals or organizations in contact with the administration in question. This could occur with program recipients, applicants, partner schools and hospitals, and so on.
-
Ask: what is the reason for the organization to collect this data?
-
To address differential coverage and selection bias:
-
Identify the data universe
-
Which individuals are included in the data and which are excluded, and why?
-
-
Identify how the intervention may affect the reporting of outcomes
-
Determine the direction in which differential selection might occur and how this might bias effect estimates.
-
-
Collect a baseline survey with identifiers for linking
-
This will ensure that you are equally likely to link treatment and control individuals to their records and identify differential coverage.
-
How serious is measurement error?
The severity of measurement error depends on the type and extent of error, as well as whether the bias is correlated with the treatment.
-
Bias that is uncorrelated with the treatment affects both the treatment and control equally, and so will not bias the estimate of the difference between the two groups at endline.
-
Bias that is correlated with the treatment is more serious: it affects the treatment and control groups differently, meaning that the estimate of the difference between the groups at endline is biased on average. This might lead to an erroneous conclusion about the sign and magnitude of the treatment effect.
Secondary data resources
Administrative data resources:
- National-level administrative data can be found on the website of the ILO (labour data), World Bank (e.g., World Development Indicators including population data), UN (e.g., SDGs and trade) and national statistics authorities
- NASA/NOAA weather data
- J-PAL North America catalog of administrative datasets (US focus)
- Credit reporting agency data is available from Equifax, Experian, and TransUnion (US focus)
- The Research Data Assistance Center (ResDAC) provides information and assistance with applying for access to data from the Centers for Medicare and Medicaid Services
- Researchers have compiled an inventory of data sets used to study education
- The American Economic Association hosts resources enumerating sources and procedures for accessing US federal administrative data.
- Google’s Dataset Search tool that “enables users to find datasets stored across thousands of repositories on the Web, making these datasets universally accessible and useful.”
Non-administrative data:
- J-PAL/IPA Datahub for Field Experiments in Economics and Public Policy
- World Bank microdata catalogue
- IFPRI microdata catalogue
- The Guardian has compiled a list of existing datasets that may be of interest to international development researchers and practitioners.
Last updated February 2022.
These resources are a collaborative effort. If you notice a bug or have a suggestion for additional content, please fill out this form.
We thank Liz Cao, Ben Morse and Katharina Kaeppel for helpful comments. All errors are our own.
Additional Resources
The Questionnaire Design section of the World Bank’s DIME Wiki, including:
Grosh and Glewwe’s Designing Household Survey Questionnaires for Developing Countries: Lessons from 15 Years of the Living Standards Measurement Study
McKenzie’s Three New Papers Measuring Stuff that is Difficult to Measure and Using BDM and TIOLI to measure the demand for business training in Jamaica via The World Bank’s Development Impact Blog
J-PAL’s Practical Guide to Measuring Girls’ and Women’s Empowerment in Impact Evaluations
Bradburn, N. M., Sudman, S., & Wansink, B. (2004). Asking questions: The definitive guide to questionnaire design : for market research, political polls, and social and health questionnaires (Rev). San Francisco: Jossey-Bass.
Deaton, A., & Zaidi, S. (2002). Guidelines for constructing consumption aggregates for welfare analysis (No. 135). World Bank Publications.
Deaton, Angus S., Measuring Poverty (July 2004). Princeton Research Program in Development Studies Working Paper. Available at SSRN: https://ssrn.com/abstract=564001 or http://dx.doi.org/10.2139/ssrn.564001
Fowler, F. J. (op. 1995). Improving survey questions: Design and evaluation. Thousand Oaks [etc.]: Sage.
Marsden, P. V., & Wright, J. D. (2010). Handbook of survey research (2nd). Bingley, UK: Emerald.
Saris, W. E., & Gallhofer, I. N. (2007). Design, evaluation, and analysis of questionnaires for survey research. Wiley series in survey methodology. Hoboken, N.J: Wiley-Interscience.
Tourangeau, R., Rips, L. J., & Rasinski, K. A. (2000). The psychology of survey response. Cambridge, U.K, New York: Cambridge University Press.
References
Abay, Kibrom A., Leah EM Bevis, and Christopher B. Barrett. "Measurement Error Mechanisms Matter: Agricultural intensification with farmer misperceptions and misreporting." American Journal of Agricultural Economics (2019).
Bursztyn, L., M. Callen, B. Ferman, A. Hasanain, & A. Yuchtman. 2014. "A revealed preference approach to the elicitation of political attitudes: experimental evidence on anti-Americanism in Pakistan." NBER Working Paper No. 20153.
Feeney, Laura (with assistance from Sachsse, Clare). “Measurement." Lecture, Delivered in J-PAL North America 2019 Research Staff Training (J-PAL internal resource)
Glennerster, Rachel and Kudzai Takavarasha. 2013. Running Randomized Evaluations: A Practical Guide. Princeton University Press: Princeton, NJ.
Karlan, Dean. “3.2 Measuring Sensitive Topics." (J-PAL internal resource)
Sachsse, Clare. “Theory of Change and Outcomes Measurement [California Franchise Tax Board / CA FTB]”, Delivered in J-PAL’s May 2019 CA FTB training. (J-PAL internal resource)
Sadamand, Nomitha. “Measuring Better: What to measure, and How?” Lecture, Delivered in J-PAL South Asia’s 2019 Measurement and Survey Design Course. (J-PAL internal resource)
Sautmann, Anja. “Measurement.” Lecture, Delivered in J-PAL North America’s 2018 Evaluating Social Programs Exec Ed Training.
Sudman, S. & N. Bradburn. 1982. Asking Questions: a Practical Guide to Questionnaire Design. A Wiley Imprint.